Sometimes, investors get intimidated by large amounts of information presented on the annual report. However, as intimidating as they look, they provide useful information when evaluating companies. If you are someone who has an affinity for numbers (like myself), you would probably find yourself going for the financial statements.
This post would focus on the Income Statement, also known as the Profit-and-Loss (P&L) accounts. This details out everything that relates to how much the company is making or losing for the year. If a company is making money, this is shown as a positive value in the net income line. However, a P&L account is way more than that. Let’s take a look at an example of the P&L account of Biogen Inc. (NASDAQ:BIIB) in 2017, which was extracted from their annual report. I have annotated a couple of key items in the annual report.
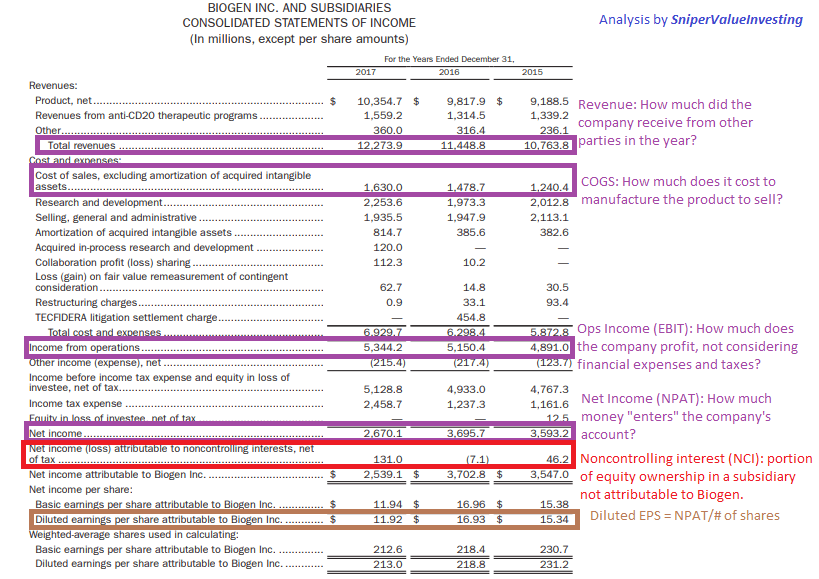
From this set of information, we can observe the following about Biogen:
- The revenue of their company mainly comes from their current products, with small portions coming in from other sources such as the anti-CD20 therapeutic programs. The revenue of the company has been rising over the 3-year-period.
- The cost of sales / cost of goods sold (COGS) has increased more than proportionately compared to their revenue, suggesting an erosion of bargaining power against suppliers.
- EBIT (Operating Income) has risen by approximately 8% from 2015 to 2017. This is likely due to the spike in the amortization of the intangible assets (likely patent expiry), the increase in R&D cost (likely to develop new patents), the collaboration profit sharing spike (which can’t be concluded much at this point), and the increase in COGS (as mentioned in 2).
- NPAT has fallen by about 33% from 2015 to 2017. This is likely due to the various factors impacting the low increase rate in EBIT, as well as the spike in income tax expenditure.
With these 4 points that are highlighted in purple in the income statement, let’s take a look at the noncontrolling interest (NCI) and the diluted earnings per share (dEPS).
NCI refers to is the portion of equity ownership in a subsidiary not attributable to the parent company, who has a controlling interest (greater than 50% but less than 100%) and consolidates the subsidiary’s financial results with its own.
Source: http://macabacus.com/accounting/noncontrolling-interest
So, imagine today Adam (representing Adam Ltd), Bala (representing Bala Pte Ltd) and Charlie (representing Charlie Pte Ltd) go into a joint venture known as ABC Pte Ltd. During the incorporation of ABC Pte Ltd, Adam Ltd owns 60% of ABC Pte Ltd, while Bala Pte Ltd and Charlie Pte Ltd each own 20% of ABC Pte Ltd. At the end of the financial year, ABC Pte Ltd has generated a total of US$10 million in revenue. However, as Adam Ltd is a listed company, it reports the earnings of ABC Pte Ltd in its P&L account. Now, to take into account of the 40% of ABC Pte Ltd she does not own, it would record an NCI of US$4 million, with NPAT due to ABC Pte Ltd attributable to Adam Pte Ltd being US$6 million. This is summarized below:

Some of the key ratios that can be taken directly from the P&L account are:
- dEPS = NPAT/Number of Shares at the End of the Financial Year
- Gross Profit Margin (GPM) = (Revenue – COGS)/Revenue = Gross Profit/Revenue
- Operating Profit Margin (OPM) = EBIT/Revenue
- Net Profit Margin (NPM) = NPAT/Revenue
- Operating Leverage = % change in EBIT/% change in Revenue
Try calculating these ratios of Biogen Inc. for yourself and see what conclusions you can draw out of them.
In conjunction with other financial statements, we can find out the following ratios:
- Return on Equity (in conjunction with balance sheet)
- Return on Asset (in conjunction with balance sheet)
- Quality of Earnings (in conjunction with cash flow statement)
Try looking at the income statements of various companies and see what you can draw out of them:
May this bring you closer to your financial freedom. Snipers, Out!
