Disclaimer: The author does not take responsibility for any factual inaccuracies made. Any opinions, conclusions, or other information expressed here is not financial advice. They are given on a general basis and are subject to change without notice. Your personal investment decisions are ultimately based on your financial goals, investment time horizon, risk appetite, and portfolio needs – which we do not advise. All information, data, and analysis here are provided “AS IS” and without warranty of any kind, either expressed or implied. Past performance is no indication of future performance; you are recommended to verify all information and consult licensed, professional financial services. The author does not take any responsibility for any loss or damage of any kind made based on the opinions or facts published in this document.
Following on with our case study on Regeneron Pharmaceuticals Inc. (Part I here), we will proceed to analyze the company’s financial statements. I will proceed to break down the company’s analysis into internal quantitative analysis (comparing the company’s financials over a set 5 year time frame) and external quantitative analysis (comparing the company’s financials with its competitors within the same 3 year time frame). We will then proceed to look into the company’s valuation metrics. For ease of calculation, we will use the restated numbers provided in Morningstar.
A. Financial Performance of the Company
The below shows a summary of some of the key data I extracted on the company from Morningstar:
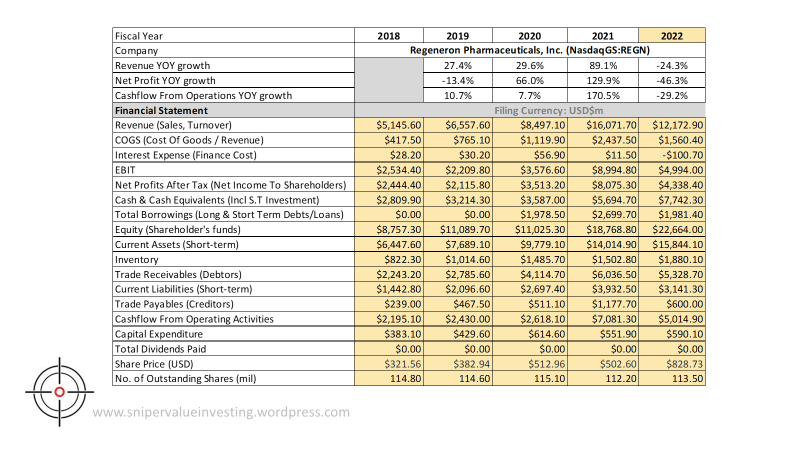
I will now proceed to show some key ratios of the company using what I call “magic numbers”.

We will analyze some key numbers as follows:
- Gross Profit Margin (GM): The company’s gross margins have been very high (above 80% of revenues), which is a good sign. However, a decrease in GM is a little worrying, which is likely due to increase in costs of raw materials. I believe this is due to the Chinese COVID-19 supply shock that happened recently.
- Operating Margin (OM): Generally strong OM of at least 30% over the past 5 years, though the fluctuations between 30-51% OM can seem a little worrying. We may want to watch what happens next for those who are interested in this company.
- Net Profit Margin (NM): NM tends to track OM quite closely, with at least 25% NM over the past few years, signifying strong pricing power.
- Company has consistent positive free cash flow (FCF) – but it is noteworthy that in 2022, FCF dipped. This is likely due to increase in R&D expenditure (to support the new pipeline of drugs for future revenues) and the drop in revenues (from supply shock).
- Return on Equity (ROE) / Return on Invested Capital (ROIC): ROE has been consistently been above 15%, which signifies strong ability by the management to put earnings reserved and shareholder capital to work. The same story can be seen when we look at the ROIC numbers, which has also been consistently above 15%.
- Net Gearing (NG): Net gearing takes into account of the net debt (total debt – cash) against shareholders equity. In this case, we see that NG has been consistently negative, meaning that the company has more cash than debt. This means that the company would be able to continue operating even in the situation of a margin call, meaning downside risks for investors is protected (and hence limited).
- Current Ratio (RC) / Interest Coverage Ratio (ICR): RC is a measure of how much current assets the company has relative to its current liabilities. In this case, the company has consistently kept at least 3.5x of its current liabilities as current assets. This means that the company is able to repay its current liabilities in a case where they become due, a good sign of management prudence. The same could be said about the company’s ICR, which has been well above my threshold of 10. In 2022, the ICR is negative because the company earned interest income instead of paying interest expenses. Imagine how strong the company’s cash position is.
- Valuation Ratio: I have a tendency to use EV/EBIT as a valuation ratio as it gives a more holistic view on the company’s operations and the valuation is based on internal factors controllable by the company. The company is now trading at about 18x EBIT after accounting for debt and cash. This seems to be very high, but considering its ROIC, it is about fair valued (17.7 / 17.6 = 1.01x).
I will now proceed to calculate if the company is likely showing signs of fraudulent activity using the SVI Beneish M-Score Calculator.
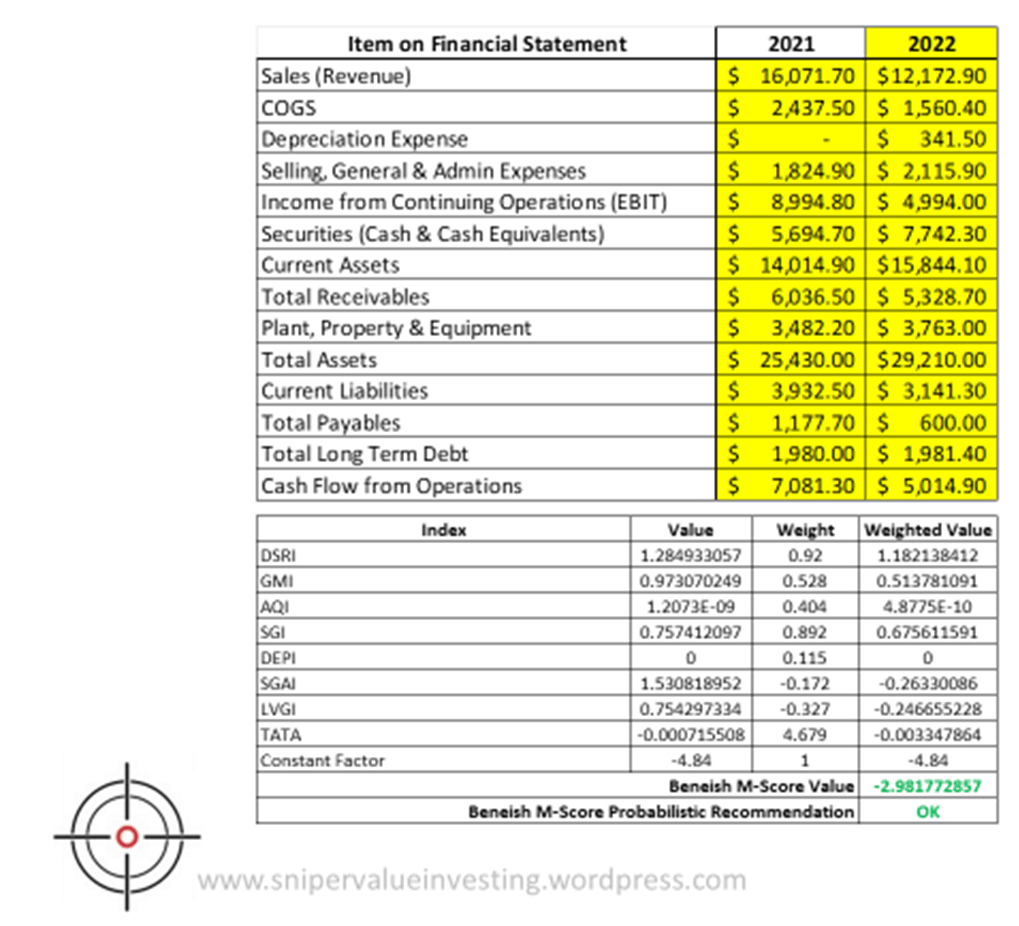
Based on the Beneish M-Score calculator, we see that the number is below -1.78, which signifies that the company is probably not doing any significant form of financial engineering to cook their books. Therefore, I would be willing to take the financial statements based on the information I have.
Combining with the qualitative analysis we have done in Part I of this case study, I would say the company is worth being on one’s watchlist. This is a company with a very strong moat, a strong, founder-led management and generally strong numbers. I would observe how far their numbers will improve before making a decision whether to buy more shares in the company.
