Disclaimer: The author does not take responsibility for any factual inaccuracies made. Any opinions, conclusions, or other information expressed here is not financial advice. They are given on a general basis and are subject to change without notice. Your personal investment decisions are ultimately based on your financial goals, investment time horizon, risk appetite, and portfolio needs – which we do not advise. All information, data, and analysis here are provided “AS IS” and without warranty of any kind, either expressed or implied. Past performance is no indication of future performance; you are recommended to verify all information and consult licensed, professional financial services. The author does not take any responsibility for any loss or damage of any kind made based on the opinions or facts published in this document.
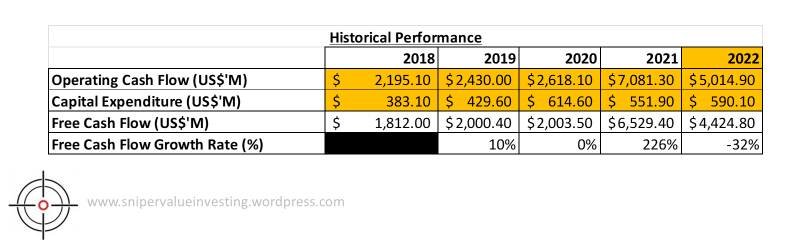
Following on with our case study on Regeneron Pharmaceuticals Inc. (Part I here, Part II here), we will proceed to do a discounted cash flow model on the company. To understand the assumptions we will make, we have to look at the numbers again:
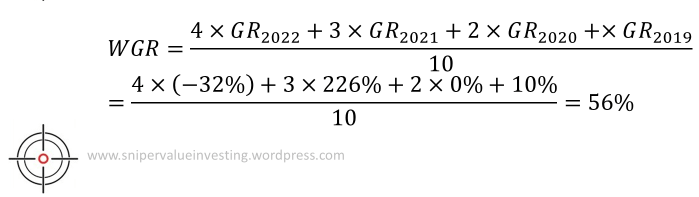
We will proceed to calculate an weighted average of the growth rate (WGR) by using the growth rates of each year (GRyyyy) the following formula:
Based on this, we have made the following assumptions:
- The growth rate as a multiple of WGR is as follows:
- Base Case: 1
- Bear Case: 0.4
- Bull Case: 1.25
- The probability of each of the following cases occurring is as follows:
- Base Case: 80%
- Bear Case: 15%
- Bull Case: 5%
- The growth rate halves every 5 years.
- The company stops growing after 15 years.
- We used the hurdle rate of 16% as this is slightly higher than the best returns pharmaceutical ETFs have given us to date (highest for pharmaceutical ETF came from VanEck Pharmaceutical ETF 3 year return at 14.52%). The slightly higher hurdle rate is to account for systematic risks of lack of diversification.
Using this model, we have built the following calculations:

As we can see, there is a value of $1916.88 per share to be extracted. However, the company is trading only at $801.79 per share. This means the company is undervalued with a good margin of safety of 58%.
We will also do a modified version of the FCF yield, where we take the company’s FCF and compare that to the enterprise value. We will then compare that to its closest competitors and do a discussion around that.
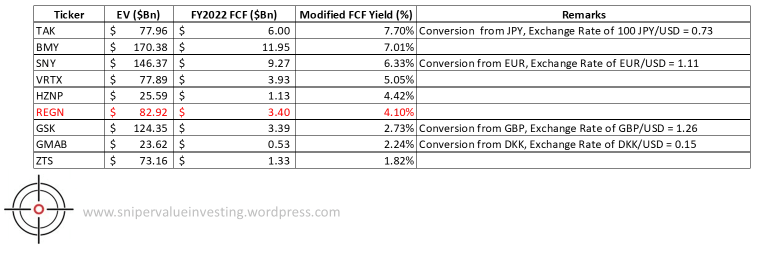
As we can observe, REGN’s 4.1% Modified FCF Yield is not the best, and there are a number of competitors that you can look at as well. This is lower than the average of 4.6%, suggesting a relative overvaluation of 12.17%.
Combining the data points from this and Part II, we can see the following:

I would say that there is still room for growth for Regeneron, but I would like to wait for the company’s share price to correct a little further before I enter. I wouldn’t mind investing a bit more now, but I will invest if the share price comes down even further. This is especially since I already own the shares of the company previously and have made a good return on investment since.
