As with any investor, we all made some mistakes along the way. Some may be big, some may be small. However, today, I would like to discuss one of my not-so-glamorous moments in investing.
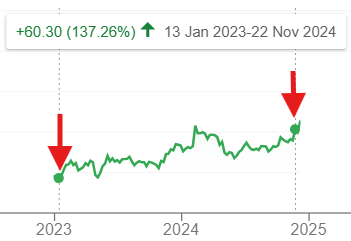
Take a look at this chart, some of you may be familiar with it:
I entered this particular share when it was $39 back in early 2023. I made almost triple my money at the end of 2024. Sounds like a good return, doesn’t it? Well, I thought so at that time…
HOW WRONG I WAS…
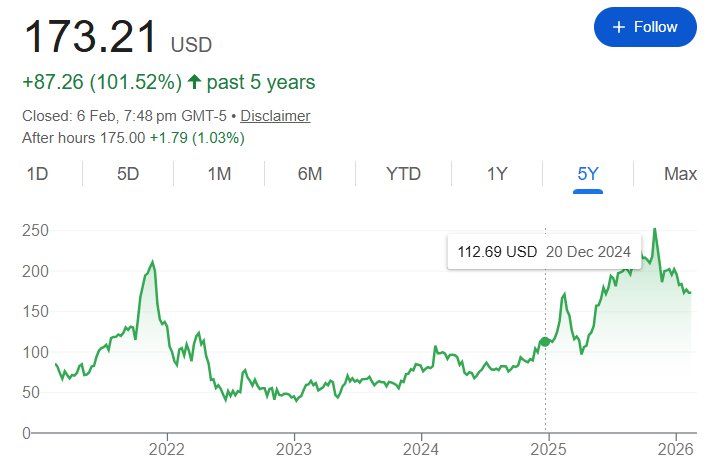
The shares actually went up by another 53% (based on the price I sold at). My oh my… How much have I missed out on…
Lesson Learnt: Don’t sell too early. Re-evaluate at every point when you are about to sell on:
Is the new share price no longer justifiable given the current fundamentals of the company?
Have I found a new company that has better fundamentals and is undervalued enough to give me more upside than what I currently have in my portfolio?
Sell only if you have answered Yes to both questions.
P.s. In case you are wondering what share this is, it is Cloudflare Inc. (NYSE:NET).
Just went through a number of companies that we decided to look into and made a decision to buy this company that we analyzed for a bit. This company is in the pharmaceutical space and we saw quite a bit of potential for growth in the future.
Alternatively, if you would like to see the full version, please reach out to us at admin@snipervi.com and we will give you the password to the full report after you have completed a number of steps we asked you to.
Disclaimer: The author does not take responsibility for any factual inaccuracies made. Any opinions, conclusions, or other information expressed here is not financial advice. They are given on a general basis and are subject to change without notice. Your personal investment decisions are ultimately based on your financial goals, investment time horizon, risk appetite, and portfolio needs – which we do not advise. All information, data, and analysis here are provided “AS IS” and without warranty of any kind, either expressed or implied. Past performance is no indication of future performance; you are recommended to verify all information and consult licensed, professional financial services. The author does not take any responsibility for any loss or damage of any kind made based on the opinions or facts published in this document.
Today, we will be switching gears to look at dividend stocks. As I am based in Singapore, we will use a Singapore Dividend stock, Mapletree Logistics Trust. In this case study, we will only do a quick valuation, without going into the details of the company.
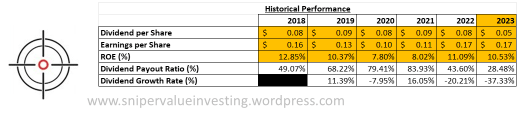
Here is the historical performance of the company:
If we were to look at a reasonable growth rate based on the formula ROE x (1 – Dividend Payout Ratio), then we will have a growth rate of 7.53%. However, considering a dividend growth rate of -37.33% in the trailing 12 months, we have adjusted this down to 4.72%.
We have also did some calculations on the fundamentals of three of the five REIT ETFs listed on SGX, and noted that the average 5 year NAV return for us is 1.38%. However, this is lower than our usual hurdle rate of 8%, which is what we are going to use.
This sets up the following calculations:
Adding up all the discounted dividend values and using a (base, bear, bull) case probability weighting of (0.8, 0.15, 0.05) in the same way we did for Regeneron Pharmaceuticals, we yield an intrinsic value of $0.37, which is way lower than the current share price of $1.73. This suggests that the company is overvalued.
Disclaimer: The author does not take responsibility for any factual inaccuracies made. Any opinions, conclusions, or other information expressed here is not financial advice. They are given on a general basis and are subject to change without notice. Your personal investment decisions are ultimately based on your financial goals, investment time horizon, risk appetite, and portfolio needs – which we do not advise. All information, data, and analysis here are provided “AS IS” and without warranty of any kind, either expressed or implied. Past performance is no indication of future performance; you are recommended to verify all information and consult licensed, professional financial services. The author does not take any responsibility for any loss or damage of any kind made based on the opinions or facts published in this document.
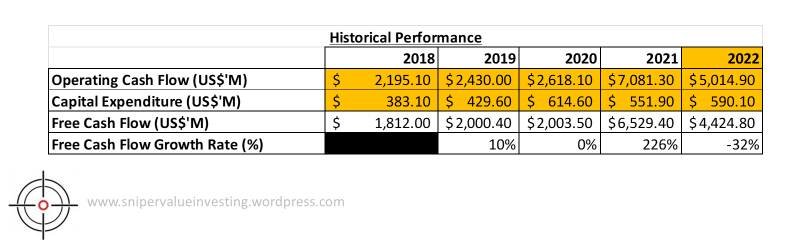
Following on with our case study on Regeneron Pharmaceuticals Inc. (Part I here, Part II here), we will proceed to do a discounted cash flow model on the company. To understand the assumptions we will make, we have to look at the numbers again:
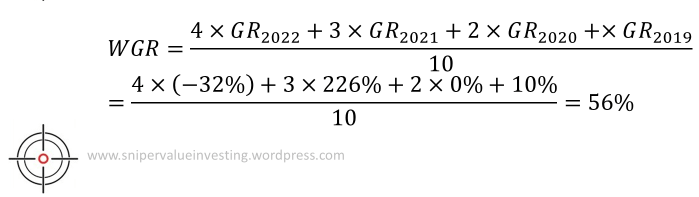
We will proceed to calculate an weighted average of the growth rate (WGR) by using the growth rates of each year (GRyyyy) the following formula:
Based on this, we have made the following assumptions:
The growth rate as a multiple of WGR is as follows:
Base Case: 1
Bear Case: 0.4
Bull Case: 1.25
The probability of each of the following cases occurring is as follows:
Base Case: 80%
Bear Case: 15%
Bull Case: 5%
The growth rate halves every 5 years.
The company stops growing after 15 years.
We used the hurdle rate of 16% as this is slightly higher than the best returns pharmaceutical ETFs have given us to date (highest for pharmaceutical ETF came from VanEck Pharmaceutical ETF 3 year return at 14.52%). The slightly higher hurdle rate is to account for systematic risks of lack of diversification.
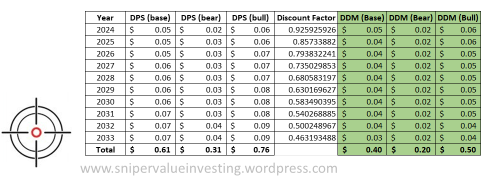
Using this model, we have built the following calculations:
As we can see, there is a value of $1916.88 per share to be extracted. However, the company is trading only at $801.79 per share. This means the company is undervalued with a good margin of safety of 58%.
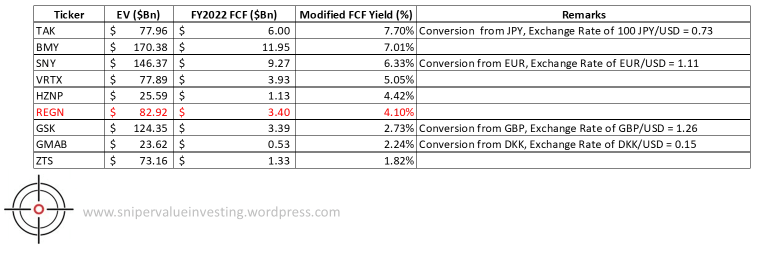
We will also do a modified version of the FCF yield, where we take the company’s FCF and compare that to the enterprise value. We will then compare that to its closest competitors and do a discussion around that.
As we can observe, REGN’s 4.1% Modified FCF Yield is not the best, and there are a number of competitors that you can look at as well. This is lower than the average of 4.6%, suggesting a relative overvaluation of 12.17%.
Combining the data points from this and Part II, we can see the following:
I would say that there is still room for growth for Regeneron, but I would like to wait for the company’s share price to correct a little further before I enter. I wouldn’t mind investing a bit more now, but I will invest if the share price comes down even further. This is especially since I already own the shares of the company previously and have made a good return on investment since.
Disclaimer: The author does not take responsibility for any factual inaccuracies made. Any opinions, conclusions, or other information expressed here is not financial advice. They are given on a general basis and are subject to change without notice. Your personal investment decisions are ultimately based on your financial goals, investment time horizon, risk appetite, and portfolio needs – which we do not advise. All information, data, and analysis here are provided “AS IS” and without warranty of any kind, either expressed or implied. Past performance is no indication of future performance; you are recommended to verify all information and consult licensed, professional financial services. The author does not take any responsibility for any loss or damage of any kind made based on the opinions or facts published in this document.
Following on with our case study on Regeneron Pharmaceuticals Inc. (Part I here), we will proceed to analyze the company’s financial statements. I will proceed to break down the company’s analysis into internal quantitative analysis (comparing the company’s financials over a set 5 year time frame) and external quantitative analysis (comparing the company’s financials with its competitors within the same 3 year time frame). We will then proceed to look into the company’s valuation metrics. For ease of calculation, we will use the restated numbers provided in Morningstar.
A. Financial Performance of the Company
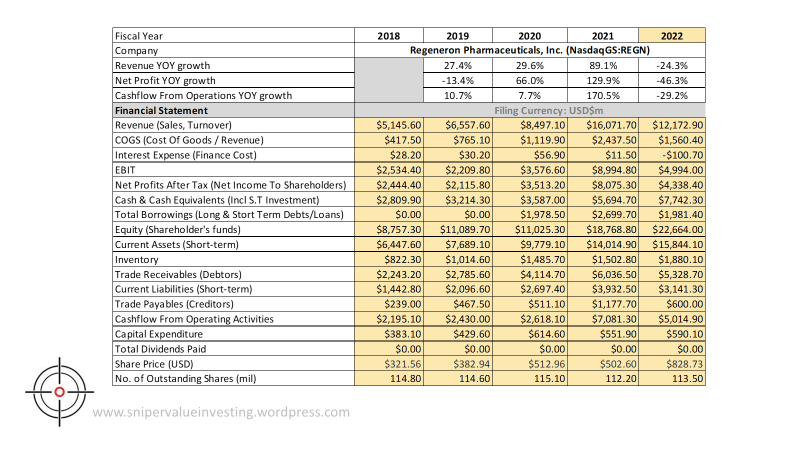
The below shows a summary of some of the key data I extracted on the company from Morningstar:
I will now proceed to show some key ratios of the company using what I call “magic numbers”.
We will analyze some key numbers as follows:
Gross Profit Margin (GM): The company’s gross margins have been very high (above 80% of revenues), which is a good sign. However, a decrease in GM is a little worrying, which is likely due to increase in costs of raw materials. I believe this is due to the Chinese COVID-19 supply shock that happened recently.
Operating Margin (OM): Generally strong OM of at least 30% over the past 5 years, though the fluctuations between 30-51% OM can seem a little worrying. We may want to watch what happens next for those who are interested in this company.
Net Profit Margin (NM): NM tends to track OM quite closely, with at least 25% NM over the past few years, signifying strong pricing power.
Company has consistent positive free cash flow (FCF) – but it is noteworthy that in 2022, FCF dipped. This is likely due to increase in R&D expenditure (to support the new pipeline of drugs for future revenues) and the drop in revenues (from supply shock).
Return on Equity (ROE) / Return on Invested Capital (ROIC): ROE has been consistently been above 15%, which signifies strong ability by the management to put earnings reserved and shareholder capital to work. The same story can be seen when we look at the ROIC numbers, which has also been consistently above 15%.
Net Gearing (NG): Net gearing takes into account of the net debt (total debt – cash) against shareholders equity. In this case, we see that NG has been consistently negative, meaning that the company has more cash than debt. This means that the company would be able to continue operating even in the situation of a margin call, meaning downside risks for investors is protected (and hence limited).
Current Ratio (RC) / Interest Coverage Ratio (ICR): RC is a measure of how much current assets the company has relative to its current liabilities. In this case, the company has consistently kept at least 3.5x of its current liabilities as current assets. This means that the company is able to repay its current liabilities in a case where they become due, a good sign of management prudence. The same could be said about the company’s ICR, which has been well above my threshold of 10. In 2022, the ICR is negative because the company earned interest income instead of paying interest expenses. Imagine how strong the company’s cash position is.
Valuation Ratio: I have a tendency to use EV/EBIT as a valuation ratio as it gives a more holistic view on the company’s operations and the valuation is based on internal factors controllable by the company. The company is now trading at about 18x EBIT after accounting for debt and cash. This seems to be very high, but considering its ROIC, it is about fair valued (17.7 / 17.6 = 1.01x).
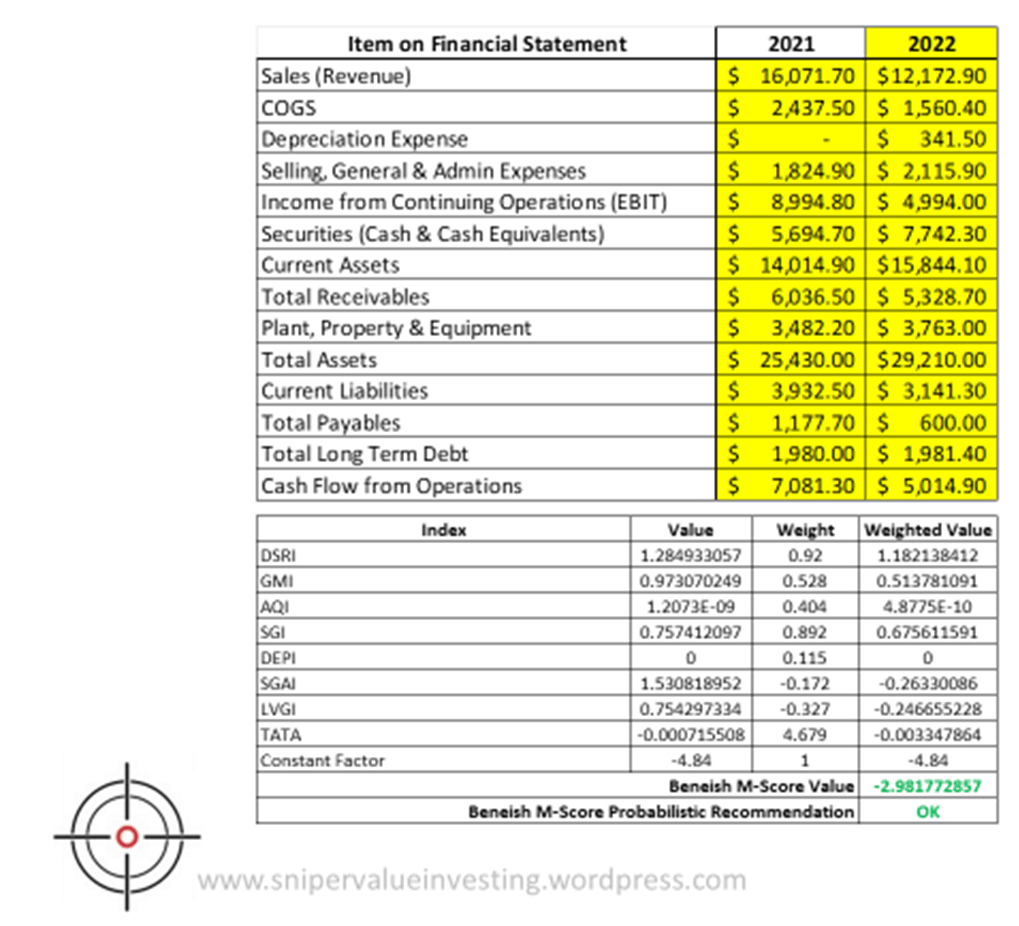
I will now proceed to calculate if the company is likely showing signs of fraudulent activity using the SVI Beneish M-Score Calculator.
Based on the Beneish M-Score calculator, we see that the number is below -1.78, which signifies that the company is probably not doing any significant form of financial engineering to cook their books. Therefore, I would be willing to take the financial statements based on the information I have.
Combining with the qualitative analysis we have done in Part I of this case study, I would say the company is worth being on one’s watchlist. This is a company with a very strong moat, a strong, founder-led management and generally strong numbers. I would observe how far their numbers will improve before making a decision whether to buy more shares in the company.
Disclaimer: The author does not take responsibility for any factual inaccuracies made. Any opinions, conclusions, or other information expressed here is not financial advice. They are given on a general basis and are subject to change without notice. Your personal investment decisions are ultimately based on your financial goals, investment time horizon, risk appetite, and portfolio needs – which we do not advise. All information, data, and analysis here are provided “AS IS” and without warranty of any kind, either expressed or implied. Past performance is no indication of future performance; you are recommended to verify all information and consult licensed, professional financial services. The author does not take any responsibility for any loss or damage of any kind made based on the opinions or facts published in this document.
We are going to embark on a new case study this month, Regeneron Pharmaceuticals Inc. This is a personal take on the company, and I am vested in this since 2019. This company has generated 128% returns since I invested.
Regeneron is a leading science and technology company that delivers life-transforming medicines for serious diseases. Founded by physician-scientists more than 30 years ago, our science-driven approach has resulted in nine FDA-approved medicines and numerous product candidates in a range of diseases, including blindness-causing eye diseases, severe inflammatory conditions like asthma and atopic dermatitis, hematologic conditions, pain and infectious diseases such as Ebola and COVID-19. In their 2021 in review, they have 9 FDA approved medicines, 30+ investigational medicines in clinical development and clinical trials going on in 55 countries. I see a lot of potential growth in this company due to the portfolio of drugs targeting major illnesses.
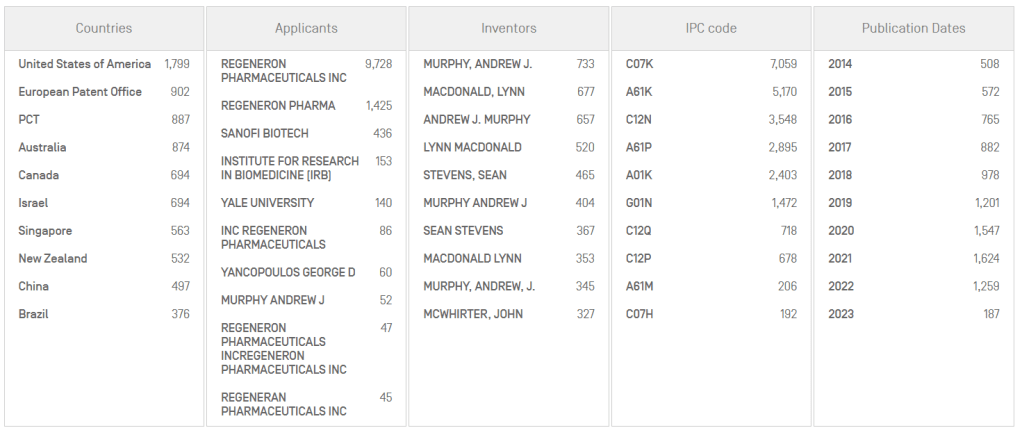
Their strong competitive advantage lies in the intellectual property that they own and their R&D efforts over the years. With 30+ drug candidates, it shows a strong pipeline for growth. Their patent portfolio spans across the world with more than 10,000 granted patents and/or applications. Every year since 2019, they had more than 1000 patents that were filed, showing their innovative spirit that is required to survive in the pharmaceutical industry. I would say with that kind of portfolio, it is a pretty strong moat that they have over time. Once the drug has been approved, they will be able to heavily monetize on the IP that they own in order to generate huge amounts of future revenues.
In terms of customers, I would say that their customer base will be mainly hospitals and pharmacies. Typically, clinics in the US would not be able to issue drugs directly, but patients will need to take their doctor’s prescription to a pharmacy, where they then get their drugs. Alternatively, they would have to get their drugs from the hospitals in the case when they are hospitalized. This typically means that they have a sticky customer base, especially since most of their drugs are approved for use by insurance companies, who would most likely foot the bill of the patients.
The company has recently reduced the ESOP program for their employees by about 20% per head, to better balance incentivization of growth and employee retention. This is their justification for their current pay structure:
As we can see, the management is quite receptive to investor feedback as far as pay structure is concerned, with a long term orientation to grow the company even further. The CEO only receives 5% salary as a risk-free compensation package, while all other incentives are driven by performance. This is compared to 28% of risk-free compensation in comparable companies. A majority of the compensation is tied to the company’s performance, which I believe is a positive sign for companies to follow.
The management is made up of mainly physician-scientists who have many years of experience in the field. The company is currently led by co-founders Leonard Schleifer and George Yancopoulos, which is something I look for as well (I have a positive bias for founder-led companies).
As mentioned, I see their innovative spirit as a very strong engine for growth. This is critical to push pipeline in the pharmaceutical industry. I like the fact that they are already doing so many clinical trials around the world for their pipeline, and look forward to them getting into global markets with their drugs.
Healthcare is an evergreen industry that never dies. New innovations are always needed to grow even further. Regeneron is well-positioned to capture the tailwinds of the less healthy population in America and around the world to grow beyond what they are today, and I can’t wait to break down their financial numbers in Part II of this case study.
Note: This is going to be a constant series as I embark on my journey in Value Investing Mentorship. If you want to find out more, please email me at team@lancequek.vc. The author does not take responsibility for any factual inaccuracies made. Any opinions, conclusions, or other information expressed here is not financial advice. They are given on a general basis and are subject to change without notice. Your personal investment decisions are ultimately based on your financial goals, investment time horizon, risk appetite, and portfolio needs – which we do not advise. All information, data, and analysis here are provided “AS IS” and without warranty of any kind, either expressed or implied. Past performance is no indication of future performance; you are recommended to verify all information and consult licensed, professional financial services. The author does not take any responsibility for any loss or damage of any kind made based on the opinions or facts published in this document.
There are many tools one can use while we invest in the markets. We will be discussing about some of them in this post. The tools discussed in this post will all be free. If you would like paid tools that are more highly sophisticated, please let us know and we will be happy to share.
Idea Generation
There are 3300 companies listed on the Nasdaq and 2800 on the NYSE alone. On top of that, there are many other opportunities in other markets like SGX (640), Tokyo Stock Exchange (3863), the two Indian stock exchanges (6600), Hong Kong Stock Exchange (2597) and many more in other markets. This means many different companies we can potentially select from to build our portfolio. Here are some tools I personally use to do screenings for stocks (and a quick review of each of them):
Dataroma: Tells one what are the top holdings of big fund managers. I personally track the following fund managers:
Finviz Fundamentals Stock Screener: Sorts stocks for potential investments by fundamentals. I think this would be able to give us a good screen of the market and what’s out there.
GuruFocus Screener: This allows you to input your targets into the portal and it will generate companies that fit your portfolio.
StockRover: They share various companies on their watchlists, and are also named the best stock picker for 2023 by Investopedia.
13F Fund Manager Holdings: Similar to Dataroma, this tells us the changes in holdings by fund managers. I sometimes use this to do some searches as a quick fix.
SeekingAlpha: Another good place where other investors post the information about why they believe a company is worth looking into.
Insurance Companies and Analyst Reports from Fund Managers: Please do your own due diligence on these reports and do not take them wholesale. I will look at their fund documents and look into their top 10 holdings. Some examples include:
Most of us would be quite busy while trying to build our portfolio due to studies, work or our own businesses. This is especially so for me as I am managing a private equity fund while doing some turnarounds for my portfolio companies. Therefore, I will need information at the tip of my hands, and here’s what I use for them:
Company Investor Relations Page: This is where the companies will share more information about their company progress to their investors. You could find this by doing a quick search “[Company Name] Investor Relations” (e.g., “Regeneron Pharmaceuticals investor relations”).
GuruFocus: On top of the stock screener function we shared earlier, there is also the ticker/company search function at the top. Just put in the stock’s tickers into the search bar and you will be able to find information on the company.
StockRow: Like GuruFocus, you will be able to screen stocks based on your criteria and find out more about the company.
Morningstar: My personal favorite so far, it has a comprehensive list of information regarding the company’s financials, presented in either chart form (up to three years) or table form. It also helps with the calculations of valuation ratios such as EV/EBIT.
Google Finance: If you want a quick fix, here’s something you can use to look at the data of a company. You can even pull data into your own Google Sheet if you want. Something good for you if you want to do a financial model as your valuation model (such as DCF).
Investing.com: Global stock screener with both qualitative and quantitative information on the company you are researching on.
Market Sentiments
Sometimes, market sentiments will also affect how the share prices move. This is where we can find potential opportunities to enter and exit the market. Here are some of the tools I use to understand the market / sectorial sentiments:
Shiller PE / CAPE / PE10 Ratio: This is the ratio is calculated by dividing a company’s stock price by the average of the company’s earnings for the last ten years, adjusted for inflation. To estimate the market sentiments, we can use the CAPE ratio of the S&P500 index and for sectors, we can do the same for the relevant sectoral ETFs.
VIX Indicator: VIX is the ticker symbol and the popular name for the Chicago Board Options Exchange’s CBOE Volatility Index, a popular measure of the stock market’s expectation of volatility based on S&P 500 index options. This tells us how volatile the market is at the material point in time.
Buffett Indicator: This is the ratio of the total United States stock market to GDP. For me, I use the historical trendline +/- 1 SD as the reference point. Anything higher will mean an overvaluation, while anything under indicates potential undervaluation.
Point and Figure Charts of Bullish Percent Indices in StockCharts: These P&F charts plot price movements for the underlying securities without taking into consideration the passage of time. An X is created when the price moves higher by a set amount, called the box size. An O is created when the price drops the box size amount. I will watch out for reversals as . I will typically track the following P&F charts (italics ones are the main ones I track):
$BPNYA: Tracks all the companies listed on the NYSE
$BPCOMPQ: Tracks all the companies listed on the Nasdaq
CNN Fear and Greed Index: Gives a simple, diagrammatic show of what’s the market sentiment at the material point in time.
I typically spend about a number of hours using some of these tools (mainly in lists 1 and 2). This is part of me doing due diligence in privately owned companies as we make decisions to invest and looking at multiples. I have a dedicated tablet with these tools (at least the ones I use frequently such as Morningstar, SEC 13F Filings) opened so that I can track them as necessary. However, I don’t typically look at market conditions often as we typically look into time in the market rather than timing the market.
As an investor, I will usually spend about 1 hour a week (on top of what I shared earlier) to just look into potential ideas we can invest in for the public markets, while leveraging on the tools we have used in the private markets to do the same.
Hope this list of tools will also help you in your investing journey.
Note: This is going to be a constant series as I embark on my journey in Value Investing Mentorship. If you want to find out more, please email me at team@lancequek.vc. The author does not take responsibility for any factual inaccuracies made. Any opinions, conclusions, or other information expressed here is not financial advice. They are given on a general basis and are subject to change without notice. Your personal investment decisions are ultimately based on your financial goals, investment time horizon, risk appetite, and portfolio needs – which we do not advise. All information, data, and analysis here are provided “AS IS” and without warranty of any kind, either expressed or implied. Past performance is no indication of future performance; you are recommended to verify all information and consult licensed, professional financial services. The author does not take any responsibility for any loss or damage of any kind made based on the opinions or facts published in this document.
Sometimes, we tend to jump into things we don’t understand in the hopes of getting great returns in a short period of time. Greed and fear are the two key emotions that drive the market, and sometimes people overreact, which causes the market to be schizophrenic.
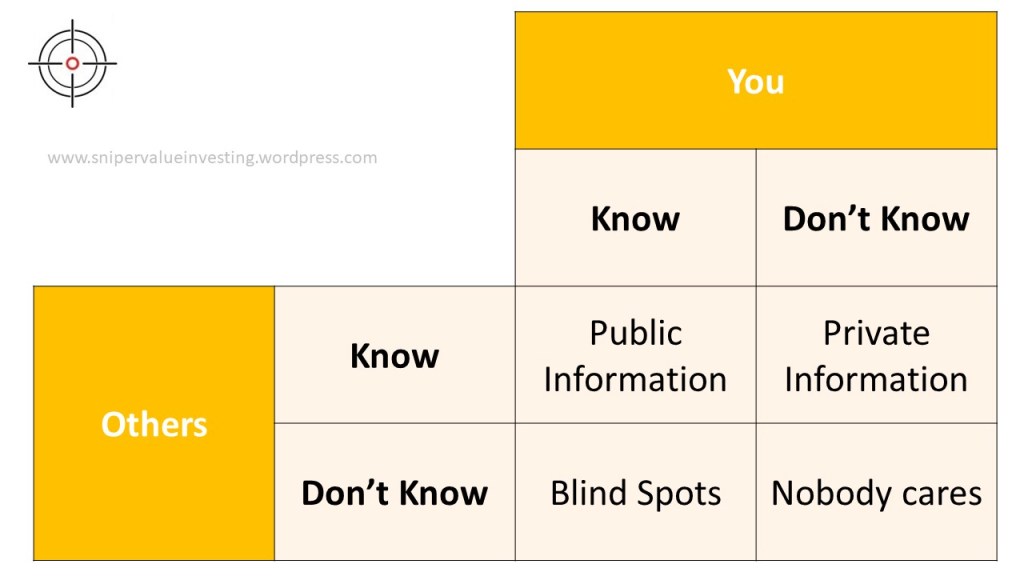
Being disciplined to stick to our Circle Of Competence, and it is important for us to know what we do and don’t know. I like to use the following diagram (modified from the Johari Window) to cover this:
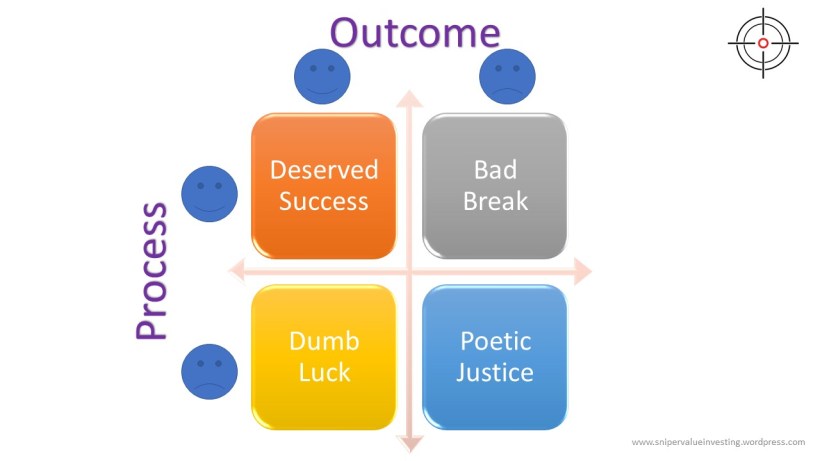
Sometimes, it is also about improving our processes over time to build a stronger and more resilient portfolio. In one of my previous posts, I mentioned the following matrix on Process v Outcome:
Now we will attempt to answer the following questions:
Why do you think it is not good to stay within your Circle Of Competence (COC)?
Sometimes, we tend to miss out on opportunities that we think we may be within our COC but actually are. This narrows down the number of companies that we could potentially select from. For example, if we don’t think companies in financial services is within our COC, we will more than likely exclude these companies from our selection, leading to a “biased” portfolio.
Why do you think it is good to stay within your COC?
If you understand a particular industry very well, you are more likely to have a rigorous process to evaluate whether a company is high quality or low quality and whether it is overvalued, fair valued or undervalued. This allows one to spot better opportunities within those sectors since different sectors will likely require different metrics. Would you trust a biotechnologist to evaluate whether a bank is in good shape? Probably not. Similarly, you probably won’t ask a banker to evaluate a biotechnology company if he/she doesn’t have any clue of how certain biological processes such as RNAi or antigen-antibody binding works.
Do you think, naturally, you are the type who will usually stay within your COC or not & why? What are you going to do or systemize to prevent potential future mistakes?
I tend to be someone who likes to explore different things (otherwise I won’t be an entrepreneur). Sometimes, it is important to watch myself when going into “unchartered territory” when it comes to value investing. It is about constantly reminding myself that there is a better opportunity another day. Like investing into the private markets, it is important to build my own due diligence checklist over time. We already have some of the quantitative models that we have built over time, and we will continue refining them as we go along.
How will you be influenced by fear and greed to make good or bad decisions in the stock market?
For me, I view investing in the markets just like investing into private companies. In fact, my brokerage account is a corporate brokerage account. In that manner, I think sometimes, it is more of watching what others are feeling in the market to know when a good time to enter is. Many a times, I have the tendency to “catch a falling knife”. I think that requires a lot of emotional stability to do. Again, it is about the psychological aspect of things that keeps me alive and well. Maybe that’s why being an entrepreneur is good because it takes away your attention from the market. Just leave it to ride as you have picked something high quality.
How can you use fear and greed for value investing and covered options selling purposes?
As mentioned, it is about putting companies of high quality into my watchlist and waiting for the falling knife to unlock the window of opportunity. Maybe it is time for me to start building some quant models to trigger price alerts as needed? Haha.
Jokes aside, fear and greed are emotions that create a schizophrenic market. Therefore, it is about leveraging on these emotions of people to make emotionally stable, sound and rational decisions when buying / selling securities. Sometimes, we just have to be cold and calculating when it comes with dealing on the market – who knows, AI might do a better job than us at that?
List the sectors or categories you think you understand and why?
Healthcare/Biotech: I was a biotechnology/biomedical structural biology student in college. One of our key research areas was around RNAi and its effects on cancer. I had gotten a grant to work on bioremediation of plastics using genetic engineering back in my days in college.
Technology: As a VC and technopreneur, I have been building and heavily investing into technology companies of the future in the private markets. With that, we have built a portfolio of at least 20 direct investments into privately held technology companies while also building a few ourselves.
List at least three companies you understand (a summary about the company) within your circle of competence (Morningstar).
Company name: Pfizer, Inc. Sector or industry: Healthcare/Biotech (Pharmaceuticals) Summary of the company: Pfizer is one of the world’s largest pharmaceutical firms, with annual sales close to $50 billion (excluding COVID-19 product sales). While it historically sold many types of healthcare products and chemicals, now, prescription drugs and vaccines account for the majority of sales. Top sellers include pneumococcal vaccine Prevnar 13, cancer drug Ibrance, cardiovascular treatment Eliquis, and immunology drug Xeljanz. Pfizer sells these products globally, with international sales representing close to 50% of its total sales. Within international sales, emerging markets are a major contributor.
Company name: Crowdstrike Holdings Inc. (Class A) Sector or industry: Technology (Cybersecurity SAAS) Summary of the company: CrowdStrike is a cloud-based cybersecurity company specializing in next-generation endpoint and cloud workload protection. CrowdStrike’s primary offering is its Falcon platform that offers a proverbial single pane of glass for an enterprise to detect and respond to security threats attacking its IT infrastructure. The Texas-based firm was founded in 2011 and went public in 2019.
Company name: Regeneron Pharmaceuticals Inc. Sector or industry: Healthcare/Biotech (Pharmaceuticals) Summary of the company: Regeneron Pharmaceuticals discovers, develops, and commercializes products that fight eye disease, cardiovascular disease, cancer, and inflammation. The company has several marketed products, including Eylea, approved for wet age-related macular degeneration and other eye diseases; Praluent for LDL cholesterol lowering; Dupixent in immunology; Libtayo in oncology; and Kevzara in rheumatoid arthritis. Regeneron is also developing monoclonal and bispecific antibodies with Sanofi, other collaborators, and independently, and has earlier-stage partnerships that bring new technology to the pipeline, including RNAi (Alnylam) and CRISPR-based gene editing (Intellia).