As with any investor, we all made some mistakes along the way. Some may be big, some may be small. However, today, I would like to discuss one of my not-so-glamorous moments in investing.
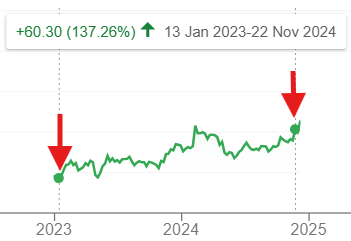
Take a look at this chart, some of you may be familiar with it:
I entered this particular share when it was $39 back in early 2023. I made almost triple my money at the end of 2024. Sounds like a good return, doesn’t it? Well, I thought so at that time…
HOW WRONG I WAS…
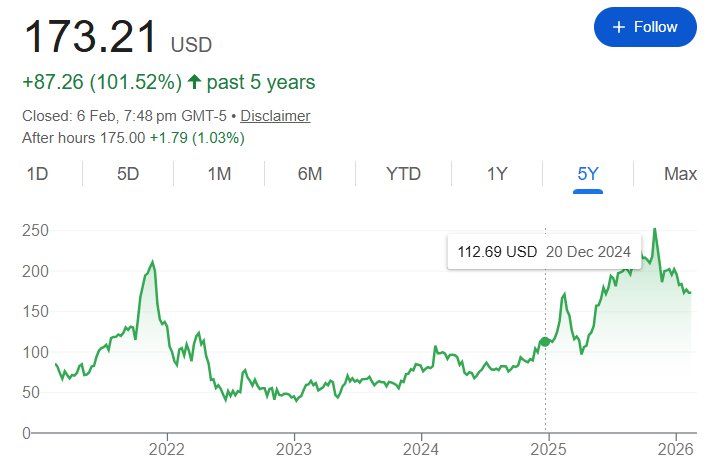
The shares actually went up by another 53% (based on the price I sold at). My oh my… How much have I missed out on…
Lesson Learnt: Don’t sell too early. Re-evaluate at every point when you are about to sell on:
Is the new share price no longer justifiable given the current fundamentals of the company?
Have I found a new company that has better fundamentals and is undervalued enough to give me more upside than what I currently have in my portfolio?
Sell only if you have answered Yes to both questions.
P.s. In case you are wondering what share this is, it is Cloudflare Inc. (NYSE:NET).
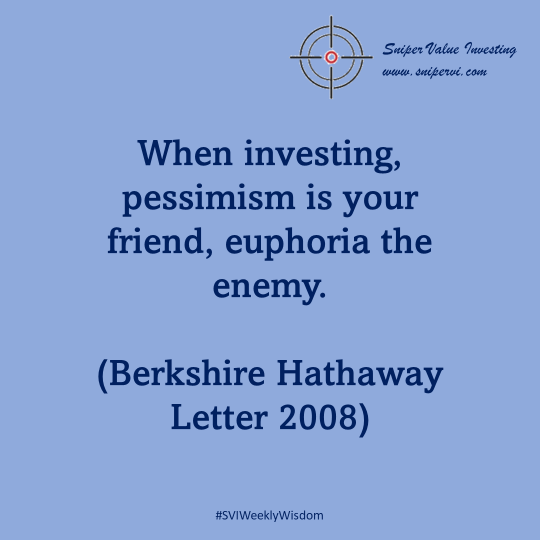
Today, we will re-visit something that was said by Warren Buffett in his letter to shareholders in 2008, at the core of the Global Financial Crisis.
Remember the days of euphoria, when everyone is all ready to buy into the markets? It is usually a sign that the markets are overhyped. Conversely, when there is uncertainty, pandemonium and blood on the streets, it is usually the best time to buy into companies with strong fundamentals at great prices. Shopping spree!
I usually aim to buy when everyone is trying to exit their positions (potentially catching falling knifes) and sell when everyone is saying buying stocks is the best investment ever. Catching falling knifes isn’t a bad thing, just make sure the falling knife you caught has strong fundamentals that will continue to generate good returns on invested capital over time.
Today marks the start of a new series, where we cover some of the classic lessons of Value Investing.
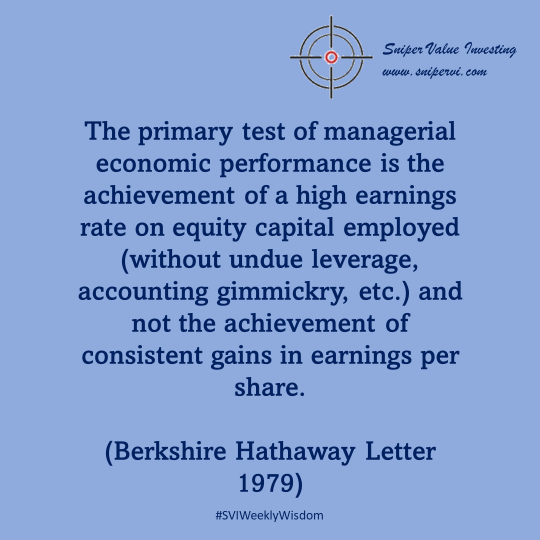
We start with something the Father of Value Investing said back in the day:
Sometimes, we are distracted by the price of a security in the short term due to market fluctuations. The market is never rational, it is driven by emotional people who look at things in an emotional manner. Therefore, it is all a popularity contest in the short term, thus a “voting machine” on a day to day basis.
However, in the long term, the market value and the stock’s intrinsic value approaches each other asymptotically. Therefore, it gives an indication of how much it is worth, a “weighing machine”.
Just went through a number of companies that we decided to look into and made a decision to buy this company that we analyzed for a bit. This company is in the pharmaceutical space and we saw quite a bit of potential for growth in the future.
Alternatively, if you would like to see the full version, please reach out to us at admin@snipervi.com and we will give you the password to the full report after you have completed a number of steps we asked you to.
Disclaimer: The author does not take responsibility for any factual inaccuracies made. Any opinions, conclusions, or other information expressed here is not financial advice. They are given on a general basis and are subject to change without notice. Your personal investment decisions are ultimately based on your financial goals, investment time horizon, risk appetite, and portfolio needs – which we do not advise. All information, data, and analysis here are provided “AS IS” and without warranty of any kind, either expressed or implied. Past performance is no indication of future performance; you are recommended to verify all information and consult licensed, professional financial services. The author does not take any responsibility for any loss or damage of any kind made based on the opinions or facts published in this document.
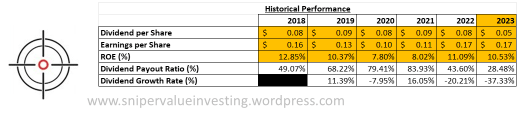
Today, we will be switching gears to look at dividend stocks. As I am based in Singapore, we will use a Singapore Dividend stock, Mapletree Logistics Trust. In this case study, we will only do a quick valuation, without going into the details of the company.
Here is the historical performance of the company:
If we were to look at a reasonable growth rate based on the formula ROE x (1 – Dividend Payout Ratio), then we will have a growth rate of 7.53%. However, considering a dividend growth rate of -37.33% in the trailing 12 months, we have adjusted this down to 4.72%.
We have also did some calculations on the fundamentals of three of the five REIT ETFs listed on SGX, and noted that the average 5 year NAV return for us is 1.38%. However, this is lower than our usual hurdle rate of 8%, which is what we are going to use.
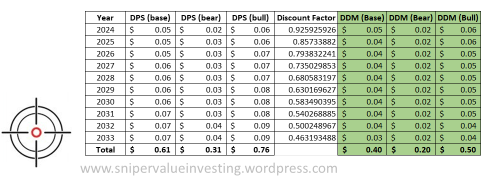
This sets up the following calculations:
Adding up all the discounted dividend values and using a (base, bear, bull) case probability weighting of (0.8, 0.15, 0.05) in the same way we did for Regeneron Pharmaceuticals, we yield an intrinsic value of $0.37, which is way lower than the current share price of $1.73. This suggests that the company is overvalued.
Disclaimer: The author does not take responsibility for any factual inaccuracies made. Any opinions, conclusions, or other information expressed here is not financial advice. They are given on a general basis and are subject to change without notice. Your personal investment decisions are ultimately based on your financial goals, investment time horizon, risk appetite, and portfolio needs – which we do not advise. All information, data, and analysis here are provided “AS IS” and without warranty of any kind, either expressed or implied. Past performance is no indication of future performance; you are recommended to verify all information and consult licensed, professional financial services. The author does not take any responsibility for any loss or damage of any kind made based on the opinions or facts published in this document.
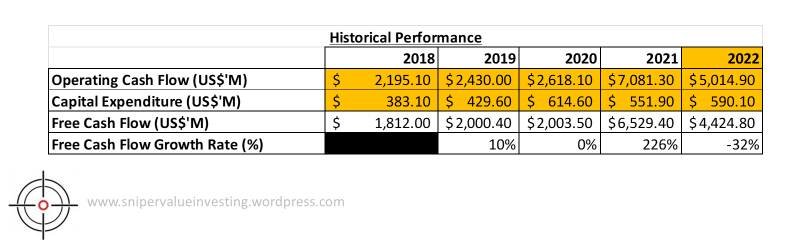
Following on with our case study on Regeneron Pharmaceuticals Inc. (Part I here, Part II here), we will proceed to do a discounted cash flow model on the company. To understand the assumptions we will make, we have to look at the numbers again:
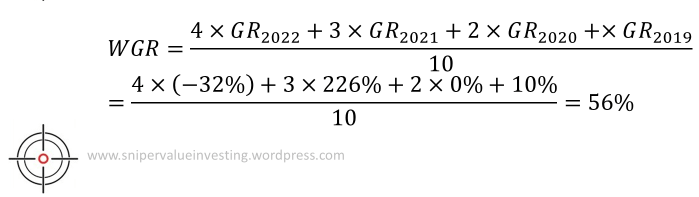
We will proceed to calculate an weighted average of the growth rate (WGR) by using the growth rates of each year (GRyyyy) the following formula:
Based on this, we have made the following assumptions:
The growth rate as a multiple of WGR is as follows:
Base Case: 1
Bear Case: 0.4
Bull Case: 1.25
The probability of each of the following cases occurring is as follows:
Base Case: 80%
Bear Case: 15%
Bull Case: 5%
The growth rate halves every 5 years.
The company stops growing after 15 years.
We used the hurdle rate of 16% as this is slightly higher than the best returns pharmaceutical ETFs have given us to date (highest for pharmaceutical ETF came from VanEck Pharmaceutical ETF 3 year return at 14.52%). The slightly higher hurdle rate is to account for systematic risks of lack of diversification.
Using this model, we have built the following calculations:
As we can see, there is a value of $1916.88 per share to be extracted. However, the company is trading only at $801.79 per share. This means the company is undervalued with a good margin of safety of 58%.
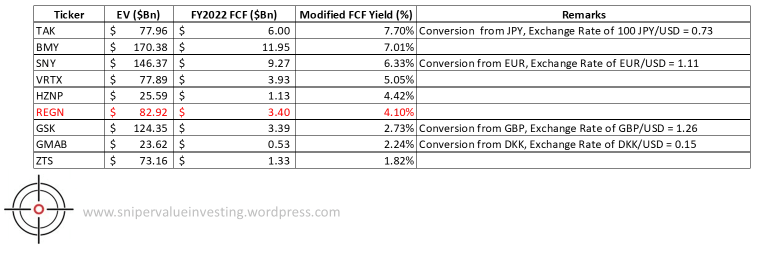
We will also do a modified version of the FCF yield, where we take the company’s FCF and compare that to the enterprise value. We will then compare that to its closest competitors and do a discussion around that.
As we can observe, REGN’s 4.1% Modified FCF Yield is not the best, and there are a number of competitors that you can look at as well. This is lower than the average of 4.6%, suggesting a relative overvaluation of 12.17%.
Combining the data points from this and Part II, we can see the following:
I would say that there is still room for growth for Regeneron, but I would like to wait for the company’s share price to correct a little further before I enter. I wouldn’t mind investing a bit more now, but I will invest if the share price comes down even further. This is especially since I already own the shares of the company previously and have made a good return on investment since.
Disclaimer: The author does not take responsibility for any factual inaccuracies made. Any opinions, conclusions, or other information expressed here is not financial advice. They are given on a general basis and are subject to change without notice. Your personal investment decisions are ultimately based on your financial goals, investment time horizon, risk appetite, and portfolio needs – which we do not advise. All information, data, and analysis here are provided “AS IS” and without warranty of any kind, either expressed or implied. Past performance is no indication of future performance; you are recommended to verify all information and consult licensed, professional financial services. The author does not take any responsibility for any loss or damage of any kind made based on the opinions or facts published in this document.
Following on with our case study on Regeneron Pharmaceuticals Inc. (Part I here), we will proceed to analyze the company’s financial statements. I will proceed to break down the company’s analysis into internal quantitative analysis (comparing the company’s financials over a set 5 year time frame) and external quantitative analysis (comparing the company’s financials with its competitors within the same 3 year time frame). We will then proceed to look into the company’s valuation metrics. For ease of calculation, we will use the restated numbers provided in Morningstar.
A. Financial Performance of the Company
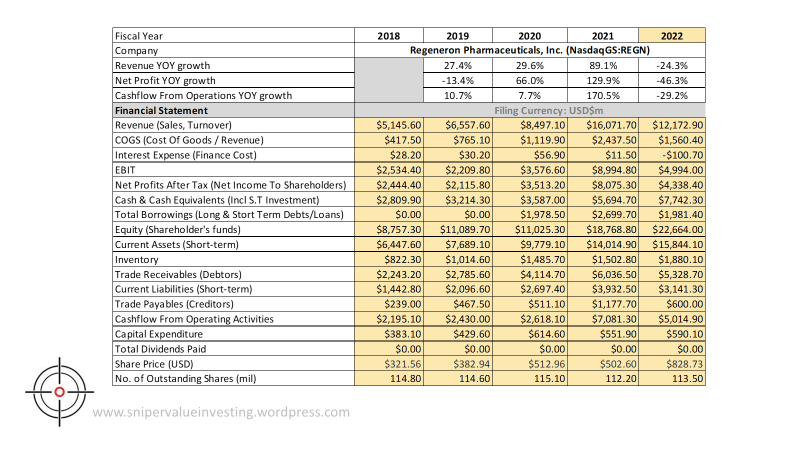
The below shows a summary of some of the key data I extracted on the company from Morningstar:
I will now proceed to show some key ratios of the company using what I call “magic numbers”.
We will analyze some key numbers as follows:
Gross Profit Margin (GM): The company’s gross margins have been very high (above 80% of revenues), which is a good sign. However, a decrease in GM is a little worrying, which is likely due to increase in costs of raw materials. I believe this is due to the Chinese COVID-19 supply shock that happened recently.
Operating Margin (OM): Generally strong OM of at least 30% over the past 5 years, though the fluctuations between 30-51% OM can seem a little worrying. We may want to watch what happens next for those who are interested in this company.
Net Profit Margin (NM): NM tends to track OM quite closely, with at least 25% NM over the past few years, signifying strong pricing power.
Company has consistent positive free cash flow (FCF) – but it is noteworthy that in 2022, FCF dipped. This is likely due to increase in R&D expenditure (to support the new pipeline of drugs for future revenues) and the drop in revenues (from supply shock).
Return on Equity (ROE) / Return on Invested Capital (ROIC): ROE has been consistently been above 15%, which signifies strong ability by the management to put earnings reserved and shareholder capital to work. The same story can be seen when we look at the ROIC numbers, which has also been consistently above 15%.
Net Gearing (NG): Net gearing takes into account of the net debt (total debt – cash) against shareholders equity. In this case, we see that NG has been consistently negative, meaning that the company has more cash than debt. This means that the company would be able to continue operating even in the situation of a margin call, meaning downside risks for investors is protected (and hence limited).
Current Ratio (RC) / Interest Coverage Ratio (ICR): RC is a measure of how much current assets the company has relative to its current liabilities. In this case, the company has consistently kept at least 3.5x of its current liabilities as current assets. This means that the company is able to repay its current liabilities in a case where they become due, a good sign of management prudence. The same could be said about the company’s ICR, which has been well above my threshold of 10. In 2022, the ICR is negative because the company earned interest income instead of paying interest expenses. Imagine how strong the company’s cash position is.
Valuation Ratio: I have a tendency to use EV/EBIT as a valuation ratio as it gives a more holistic view on the company’s operations and the valuation is based on internal factors controllable by the company. The company is now trading at about 18x EBIT after accounting for debt and cash. This seems to be very high, but considering its ROIC, it is about fair valued (17.7 / 17.6 = 1.01x).
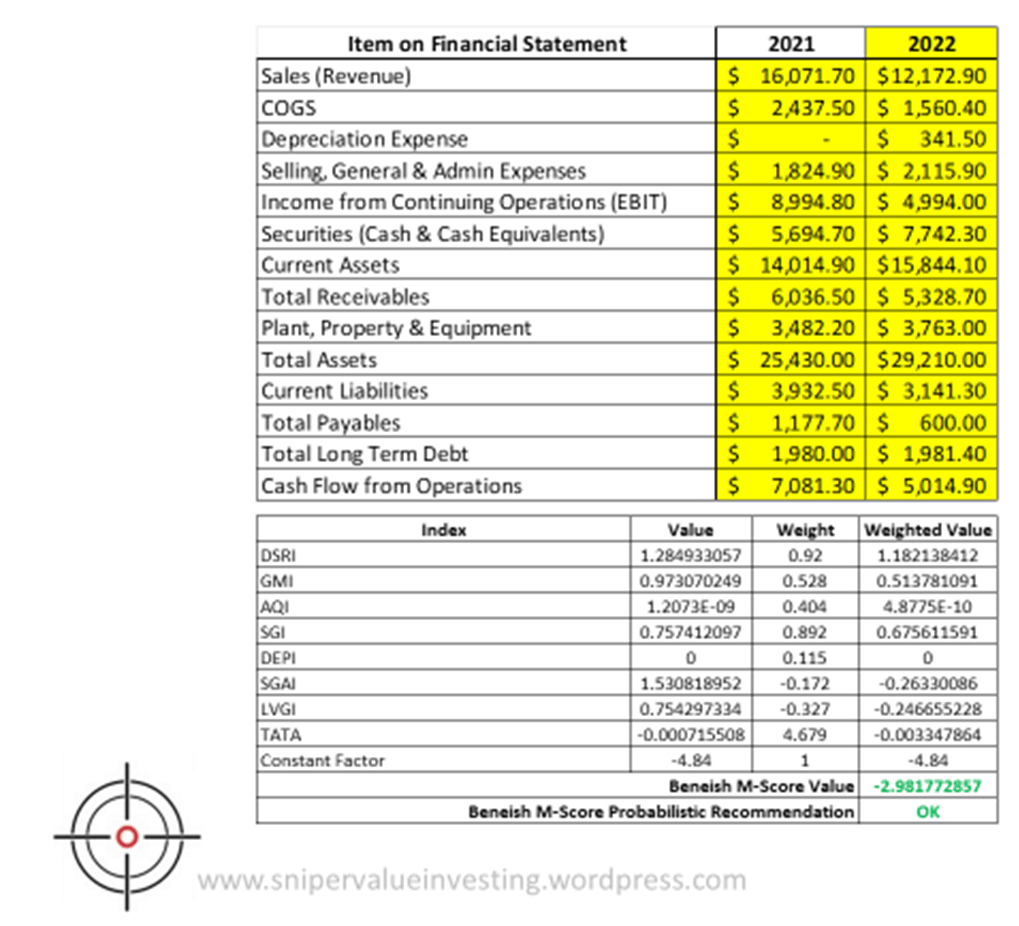
I will now proceed to calculate if the company is likely showing signs of fraudulent activity using the SVI Beneish M-Score Calculator.
Based on the Beneish M-Score calculator, we see that the number is below -1.78, which signifies that the company is probably not doing any significant form of financial engineering to cook their books. Therefore, I would be willing to take the financial statements based on the information I have.
Combining with the qualitative analysis we have done in Part I of this case study, I would say the company is worth being on one’s watchlist. This is a company with a very strong moat, a strong, founder-led management and generally strong numbers. I would observe how far their numbers will improve before making a decision whether to buy more shares in the company.
Disclaimer: The author does not take responsibility for any factual inaccuracies made. Any opinions, conclusions, or other information expressed here is not financial advice. They are given on a general basis and are subject to change without notice. Your personal investment decisions are ultimately based on your financial goals, investment time horizon, risk appetite, and portfolio needs – which we do not advise. All information, data, and analysis here are provided “AS IS” and without warranty of any kind, either expressed or implied. Past performance is no indication of future performance; you are recommended to verify all information and consult licensed, professional financial services. The author does not take any responsibility for any loss or damage of any kind made based on the opinions or facts published in this document.
We are going to embark on a new case study this month, Regeneron Pharmaceuticals Inc. This is a personal take on the company, and I am vested in this since 2019. This company has generated 128% returns since I invested.
Regeneron is a leading science and technology company that delivers life-transforming medicines for serious diseases. Founded by physician-scientists more than 30 years ago, our science-driven approach has resulted in nine FDA-approved medicines and numerous product candidates in a range of diseases, including blindness-causing eye diseases, severe inflammatory conditions like asthma and atopic dermatitis, hematologic conditions, pain and infectious diseases such as Ebola and COVID-19. In their 2021 in review, they have 9 FDA approved medicines, 30+ investigational medicines in clinical development and clinical trials going on in 55 countries. I see a lot of potential growth in this company due to the portfolio of drugs targeting major illnesses.
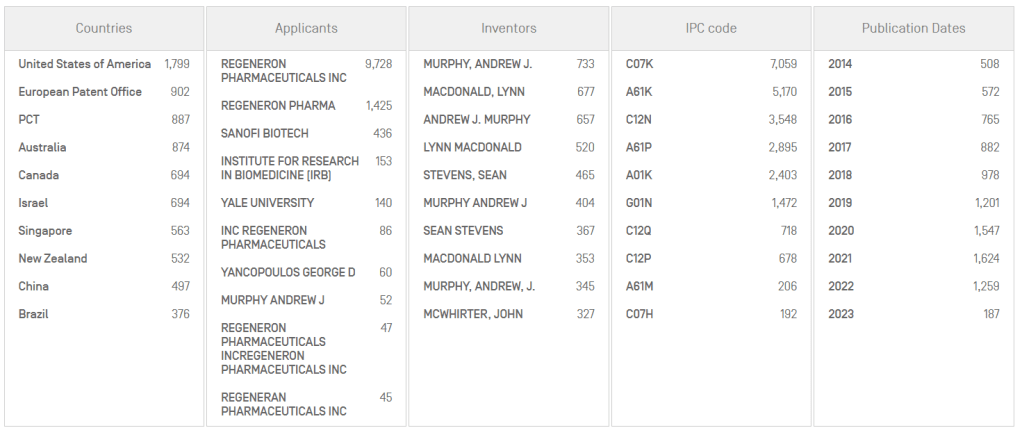
Their strong competitive advantage lies in the intellectual property that they own and their R&D efforts over the years. With 30+ drug candidates, it shows a strong pipeline for growth. Their patent portfolio spans across the world with more than 10,000 granted patents and/or applications. Every year since 2019, they had more than 1000 patents that were filed, showing their innovative spirit that is required to survive in the pharmaceutical industry. I would say with that kind of portfolio, it is a pretty strong moat that they have over time. Once the drug has been approved, they will be able to heavily monetize on the IP that they own in order to generate huge amounts of future revenues.
In terms of customers, I would say that their customer base will be mainly hospitals and pharmacies. Typically, clinics in the US would not be able to issue drugs directly, but patients will need to take their doctor’s prescription to a pharmacy, where they then get their drugs. Alternatively, they would have to get their drugs from the hospitals in the case when they are hospitalized. This typically means that they have a sticky customer base, especially since most of their drugs are approved for use by insurance companies, who would most likely foot the bill of the patients.
The company has recently reduced the ESOP program for their employees by about 20% per head, to better balance incentivization of growth and employee retention. This is their justification for their current pay structure:
As we can see, the management is quite receptive to investor feedback as far as pay structure is concerned, with a long term orientation to grow the company even further. The CEO only receives 5% salary as a risk-free compensation package, while all other incentives are driven by performance. This is compared to 28% of risk-free compensation in comparable companies. A majority of the compensation is tied to the company’s performance, which I believe is a positive sign for companies to follow.
The management is made up of mainly physician-scientists who have many years of experience in the field. The company is currently led by co-founders Leonard Schleifer and George Yancopoulos, which is something I look for as well (I have a positive bias for founder-led companies).
As mentioned, I see their innovative spirit as a very strong engine for growth. This is critical to push pipeline in the pharmaceutical industry. I like the fact that they are already doing so many clinical trials around the world for their pipeline, and look forward to them getting into global markets with their drugs.
Healthcare is an evergreen industry that never dies. New innovations are always needed to grow even further. Regeneron is well-positioned to capture the tailwinds of the less healthy population in America and around the world to grow beyond what they are today, and I can’t wait to break down their financial numbers in Part II of this case study.