Sometimes, we see free cash flow (FCF) as the key metric when we analyze some companies. Recently, I learnt about a new metric known as owner’s earnings (OE) from Xin Er and Rupam, which I find pretty interesting. This post will be talking that.
What I received from them was in fact a 20-page document detailing everything about how OE is calculated and used in the valuation of the company, specifically stating about its advantages and drawbacks compared to FCF. This surfaced to me because of a recent stock I was looking at, Biostar Pharmaceuticals Inc. (NASDAQ:BSPM), which had shown an increase in cash and cash equivalents despite making a loss in the same year. Let’s take a look at their 2017 income and cash flow statements:


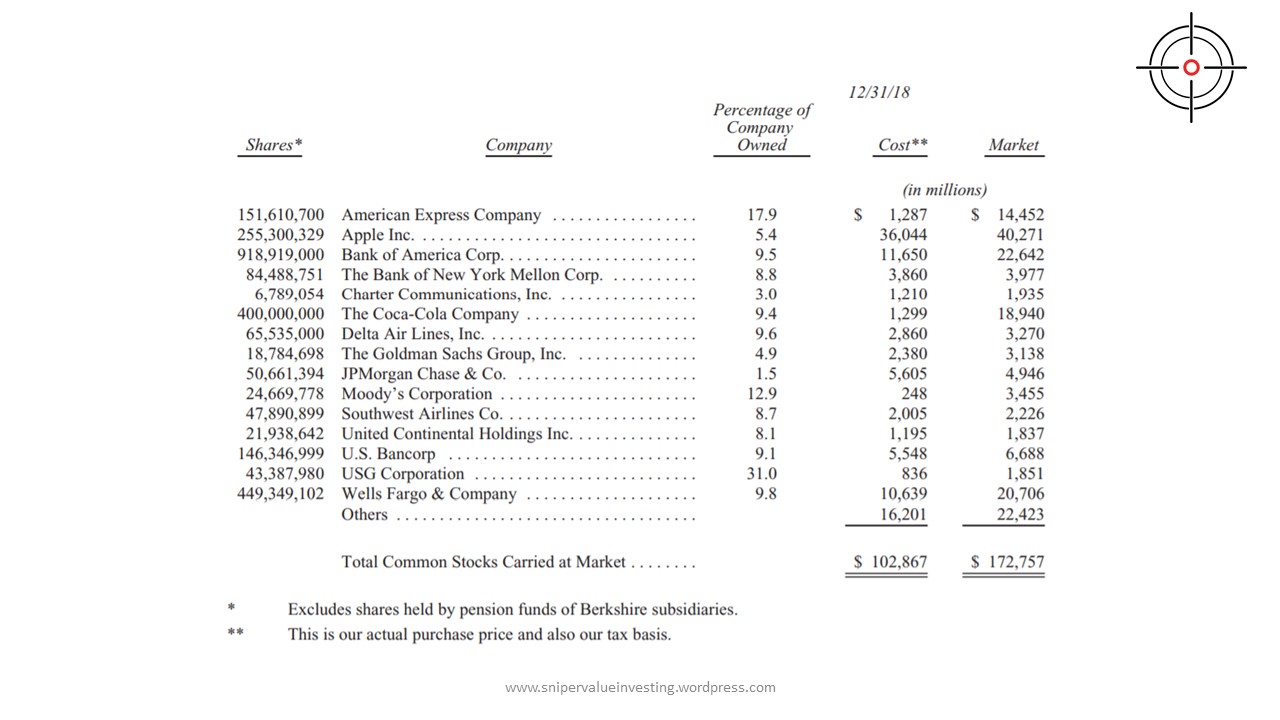
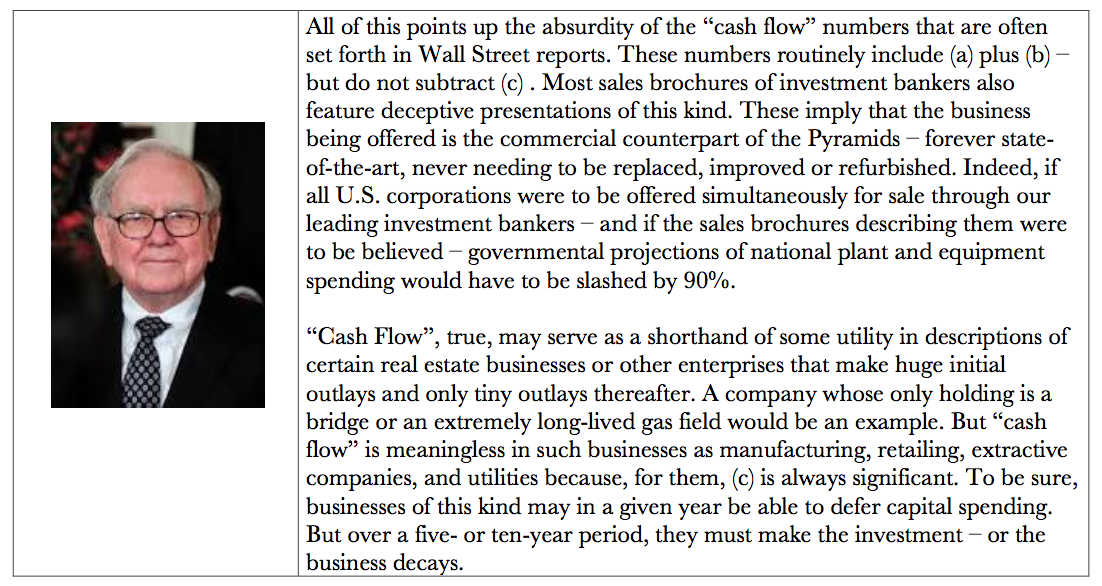
OE is a term coined by Warren Buffett in 1986 when he wrote his letter to shareholders of Berkshire Hathaway Inc. (NYSE:BRK/A) (NYSE:BRK/B). It is defined as a representation of (a) reported profits plus (b) any form of non-cash charges due to depreciation, depletion, amortization, and certain other non-cash charges such as the company’s items less (c) the average annual amount of capitalized expenditures for plant and equipment, etc. that the business requires to fully maintain its long-term competitive position and its unit volume. (If the business requires additional working capital to maintain its competitive position and unit volume, the increment also should be included in (c) . However, businesses following the LIFO inventory method usually do not require additional working capital if unit volume does not change.)
Here’s what Warren Buffett said about FCF:
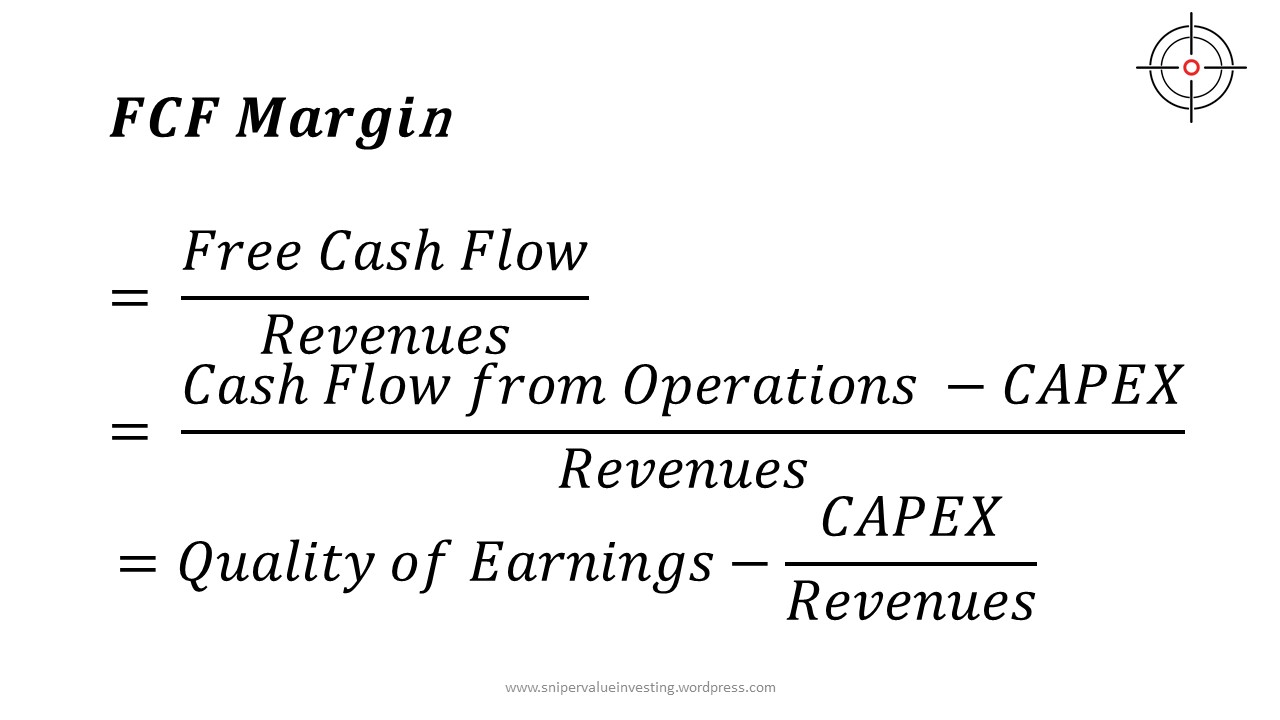
This definition sounds like a mouthful, so let me try to break it down for you. Most of the time, this would be very close to FCF, which is simple the cash flow from operations less capital expenditure. However, under certain circumstances, OE can differ quite a bit from FCF. Let us try to derive the OE of My Startup Company Pte Ltd based on the simulation below:
My Startup Company Pte Ltd (MSC) is a startup that focuses on the sales of energy across to households in Singapore due to the opening up of the energy market by the Energy Market Authority of Singapore. The company was incorporated on January 1, 2015, with financial year ending on December 31 of every year.
To simplify his accounting, the entrepreneur – Alan – decides to bear the cost of incorporation (allowing MSC to start off on a clean slate). His company lawyer that did the incorporation created 100,000 shares (with a value of $1 per share) and gave Alan 10,000 shares (for some reason he agreed to those terms). Alan decides to invest $110,000. This gives MSC a cash injection of $110,000 even before the company even started operations (income and expenses are still zero). Here’s how MSC’s balance sheet will look like:
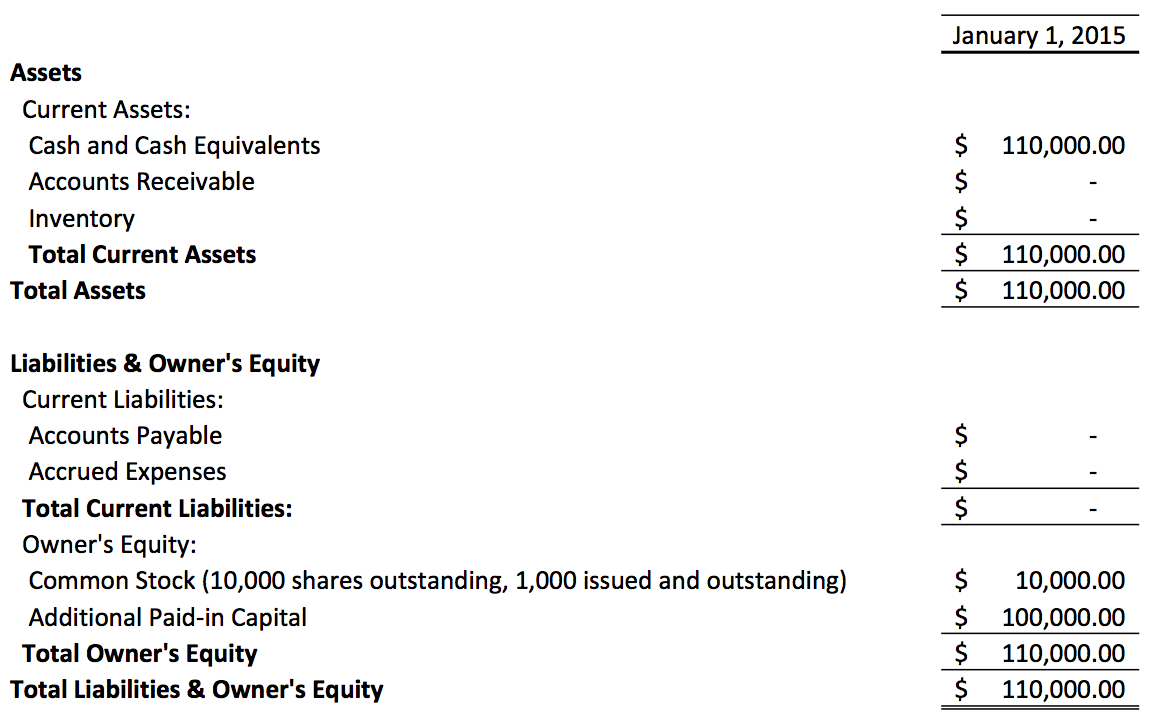
This balance sheet is probably pretty straight forward. Alan pumps in a total of $110,000 of his own money into the business’ checking account. $10,000 of this money is converted into his shares, which the other $100,000 is considered as additional paid-in capital. This money is given to the company as its cash and cash equivalents (CCE). Note that the additional paid in capital is what Alan invested above and beyond the par value of the stock!
Sometimes, investors don’t want to just look at your balance sheet. Today, Bala, a potential angel investor decide to ask Alan for his cash flow statement as he is planning to invest in the company. Here’s what Alan sent to Bala (after asking Bala to sign an NDA):
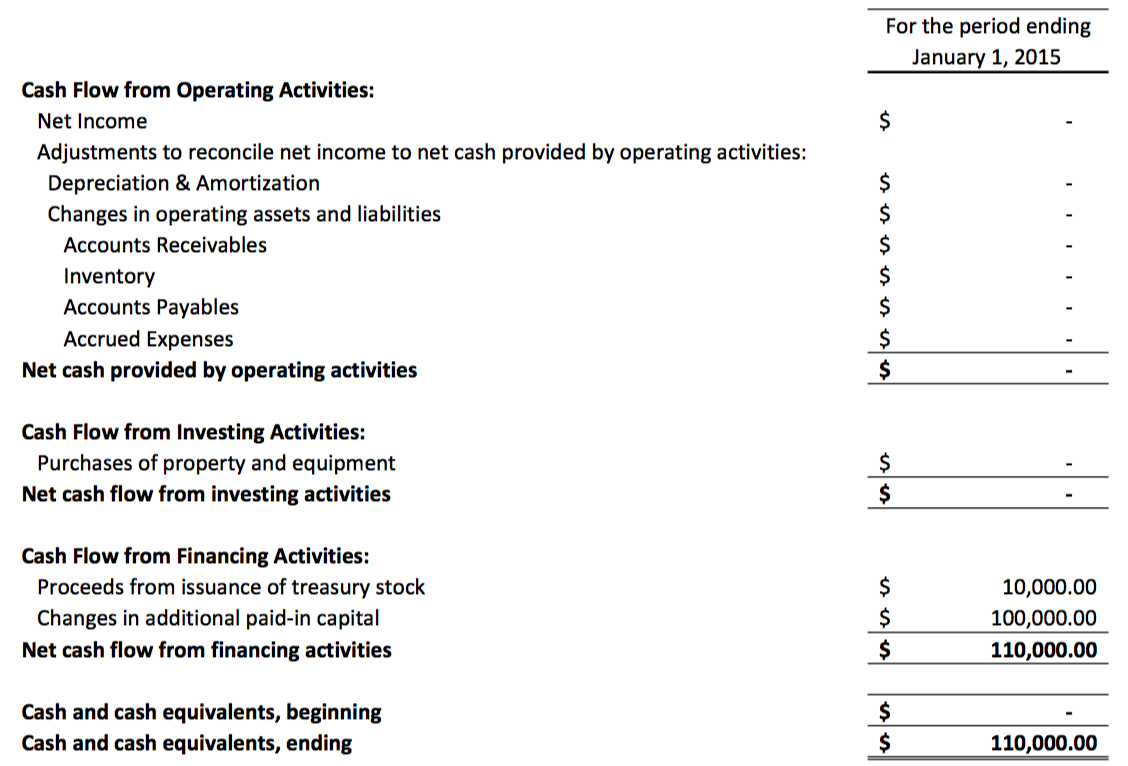
As seen on this cash flow statement, there is no sale and profit generated at this point. There are no changes in inventories, accounts payables/receivables and accrued expenses. Hence, there is no cash flow from “operating activities” as there are no business activities to speak of at this point. There was no property and equipment purchased, so there is no cash flow from “investing activities”. However, the balance sheet showed an increase in CCE of $110,000 due to Alan’s investment. Therefore, there is a cash inflow from financing activities of $110,000. Of course, Bala would say “your idea looks great, but you need to get some sales to confirm that it works. For those reasons, I’m out!”
To fulfil Bala’s order for electricity for his office, Alan has bought a generator that costs him $50,000 (it’s pretty huge), as well as an additional $950 on some marketing materials to attract new customers. On top of that, he pays $50 to the telco for a business phone so that he can be contactable for business. Now, MSC is ready for business! Yay!
As Bala gave Alan a piece of advice before he left about lean startup, Alan decides to heed the advice and operate it out of a space in his dad’s plant (which is seriously huge by the way). Ready to make his first bucket of gold from here, Alan decides to hire a commission-only sales rep to go around and get business (PDPA doesn’t exist in this parallel universe). He estimates that his cost of manufacturing for Bala’s deal will be $5,000 per MWh. Suppose he sells to Bala at $10,000 per MWh and give the sales rep a 25% commission ($2,500), he will turn an operating margin of 25%.
On February 15, 2015, the sales rep approaches Bala (since there was already a relationship between him and Alan) and brings in an order from him for 5MWh for Bala’s factory just nearby. Alan records the sale in his books and runs the generator to produce the 5MWh of electricity for Bala. It takes 6 weeks to generate the energy and Bala has 30 days to pay up upon the completion of the power delivery. Of course, being a shrewd businessman, Bala would delay payment till end of April 2015 to make the payment so that he has a good cash conversion cycle on his listed company that manages the factory. Let’s take a look at MSC’s finances at the end of March 31, 2015.

Now, let’s check out his balance sheet.
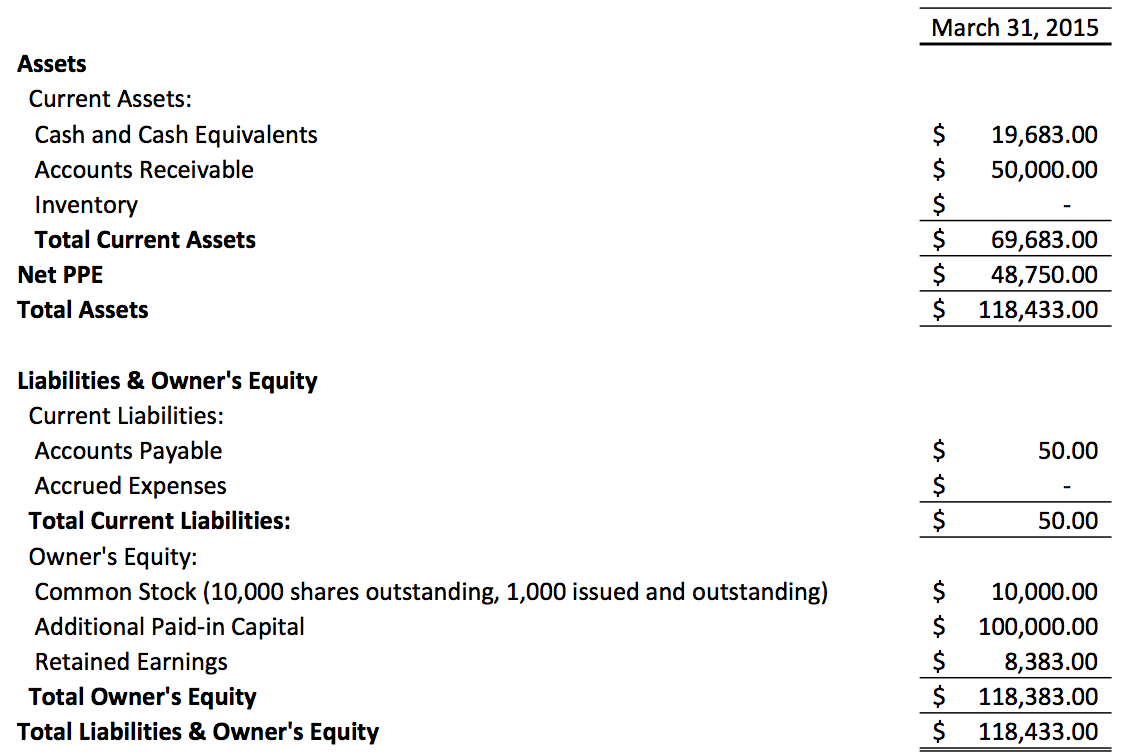
Things look quite alright at this point. Owner’s equity is up by $8,383 due to the net income that we saw in the income statement. We see an increase in accounts receivable of $50,000 due to Bala’s order, and a reduction in CCE to $19,683 due to the expenses in the income statement. However, as the generator has a depreciation of $5,000 every year, or $1,250 every quarter, we deduct the depreciation from our net property, plant and equipment (Net PPE).
As usual, phone bills are only payable 10 days after receipt of the bill. So Alan decides to learn that same trick from Bala and delay its payment until the very last minute. As such, there is an accounts payable of $50 to account for the phone bill that is unpaid. MSC has not racked up any accrued expenses (an accounting expense recognized in the books before it is paid for) thus far.
Which is pretty much about now…

For the sake of illustration, let us work bottom up. Just before Alan invests the $110,000, MSC has no money in the bank, therefore leading to a CCE beginning with 0. We also know that the company has a total of $46,400 in the bank after this quarter (from the balance sheet), accounting for the $46,400 in CCE ending. So what exactly happens in between.
Moving into cash flow from financing activities, we conclude that Alan has invested the $110,000 at the start of the year. This is consistent with the cash flow statement when the company first started.
Moving up is the cash flow from investing activities, we can see that Alan purchased the generator to produce the electricity for his clients. The generator requires a cash payment of $50,000, leading to a cash outflow from investing activities of $50,000.
Moving up into the cash flow from operating activities (where it gets a little tricky), we need to reconcile the $8383 net income and the actual cash generated from the operations of MSC. So let us start with the net income of $8383, because that’s reported in the income statement. Now let’s add and subtract the various operating items that is required or generated cash on paper but not in actual fact.
- Depreciation: Rather than taking a total deduction of $50,000 from the company’s income statement, Alan can write off the generator over 10 years. In this case, Alan is writing $1,250 off his tax return each quarter for the next 40 quarters. Although it is a perfectly legal write-off, the depreciation does not require a cash outlay; so, we add the depreciation back into the $8,383 as we reconcile net income to net cash from operations.
- Accounts Receivable: MSC has a revenue from Bala of $50,000 but has not been collected in actual revenue. As such, there needs to be a deduction in the cash flow statement until the cash actually comes into the bank.
- Accounts Payable: MSC has received the total phone bill of $150 but has only paid $100. The company wrote off $150 but only used $100 of cash. Therefore, we need to add back the $50 in accounts payable into the cash flow statement until the cash actually leaves the bank.
Now let us activate our most advanced technology of our imaginations, the time machine and travel into the future in December 31, 2017.
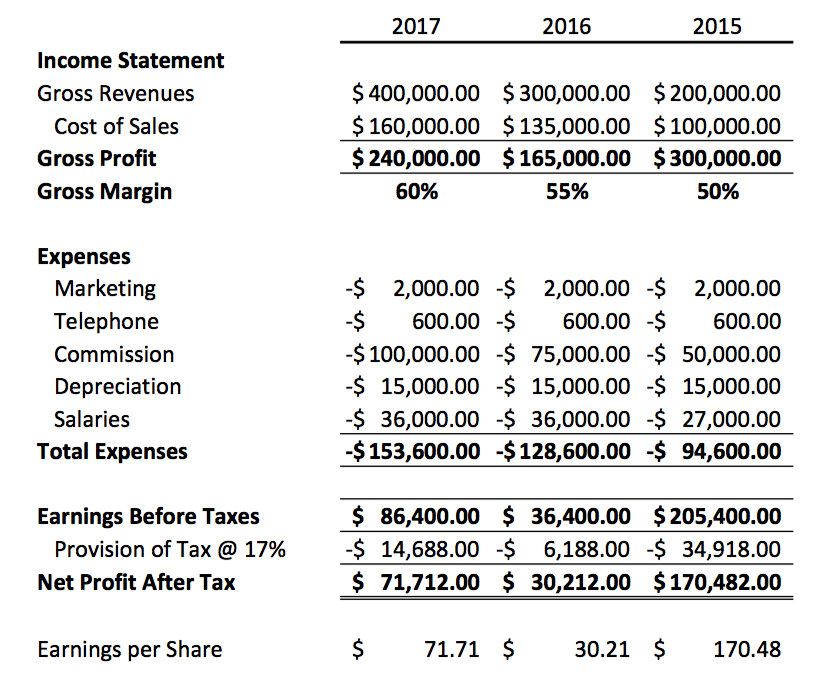
At a quick glance, we can see an improvement in gross margin from 50% to 60%. Also, we can see good growth due to marketing expenses staying constant despite its increase in gross profits. Alan starts taking a $3,000 per month salary starting from April 2015. Depreciation and telephone bills are constant as there are no increases in any form of telephone bills and there are no new generators purchased.
Let’s now take a look at the balance sheets:
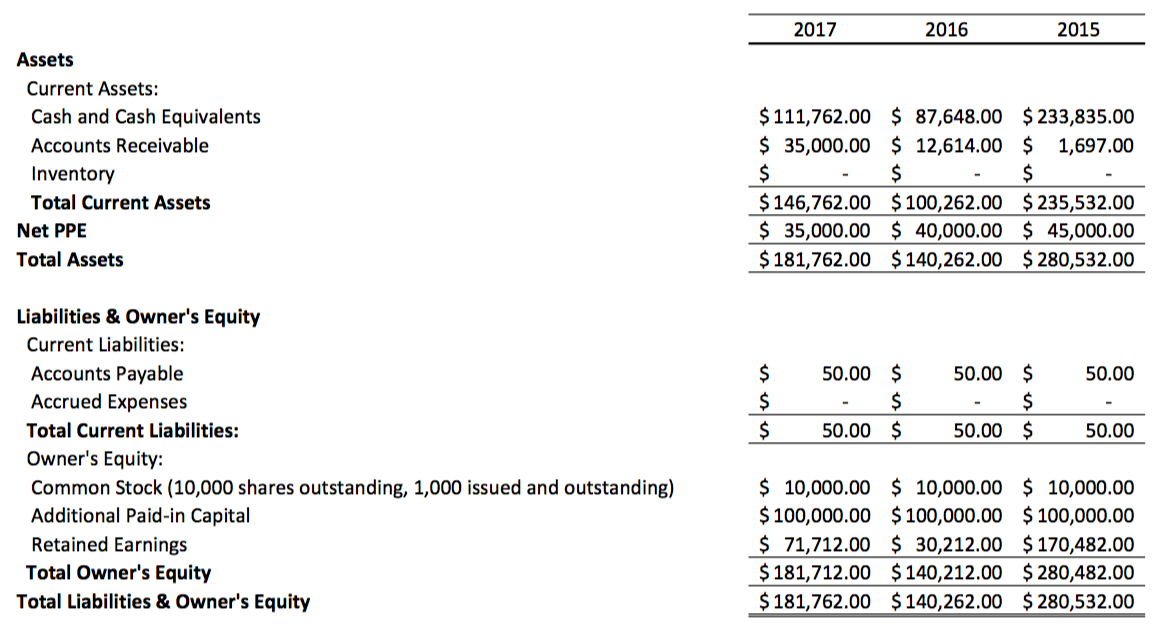
Each year, MSC has ended the year with more sales outstanding than the prior year, which is not a cause for joy or concern; it is what it is! We’ll see if it’s problematic in OE! PPE shows the ongoing depreciation of the generator as it becomes less and less valuable! On the liabilities side, we see that the company ends each year with $50 of Accounts Payable. That is the $50 December phone bill that is due on January 10th of the following year. Finally, we see that retained earnings has grown as the company continues to show profits each year.
Let’s move on to the cash flow statement.

And now the whole story comes together. In this case, we can see that accounts receivables at the end of 2015 is $1,697 more than it is in the beginning of the year. The same reasoning goes for the other account receivables. Let’s now check out the differences between FCF and OE.

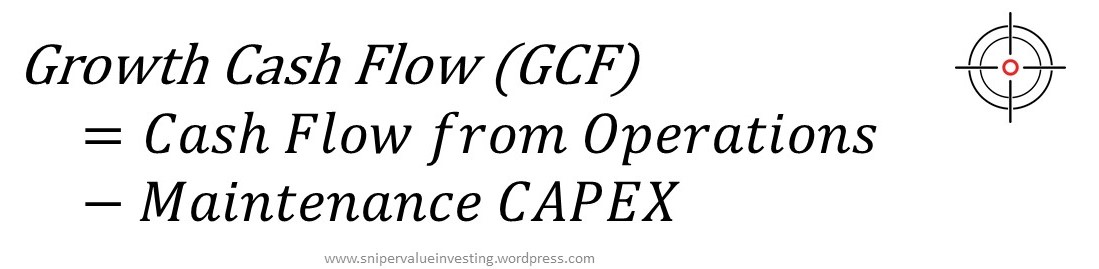
The key difference between the two is that FCF does not take into account of any future spending the company might incur in the future. This is equivalent to treating it like a one-off event in the past. With OE, you are attempting to figure out how much cash would be left over for owners if the business budgeted for future capital expenditures.
Some businesses do plan and budget very well, thus helping assure investors that capital expenditures will remain fairly constant year-on-year. Such is not the case with MSC! For example, we see that there is a need to plan for future capital expenditure in 2016, but this is not taken into account in 2015. Alan, you have so much more to learn!
After analyzing our example of MSC in the parallel universe, let’s analyze an actual company, General Motors (NYSE:GM). Here is their cash flow statement from 2005 to 2007.

In the case of GM, we can see that the FCF and OE would yield drastically different results (all values stated in millions):

The 2007 FCF shows that GM generated $189 million from operations, a turnaround from its FCF losses of $20 billion and $25 billion in 2006 and 2005, respectively. If investors are solely focused on FCF, he would probably think “Hmmm… The business might see the 2006 loss of $20 billion – $5 billion better than in 2005. This looks like a sign of improvement!”
When GM began generating positive FCF in 2007, the investor might mistakenly think that GM had fixed its problems, turned the corner, and was potentially poised for growth. So guess what, he screams “Hooray!” and goes into the stock market and buy the stock.
Now, hold on to your chairs… The OE paints a completely different picture altogether!
Starting with Net Loss from continuing operations (we need to see the performance of the ongoing business), we adjust for the various items, with capital expenditure being $71 billion for the previous 9 years (i.e. $7.8 billion per year or so). OE shows that everything is going downhill for GM from 2005 to 2007 (at an increasing rate for that matter). This difference can be explained from the non-cash charges that GM deducted from earnings, but that were added back in when reconciling the cash flow statement. OE has the ability to see that FCF may not completely benefit owners.
Now, let’s take a look at the derivation to the final OE of GM. Over the long-term, the capital expenditure and depreciation should be equal. However, this isn’t the case when it comes to GM (which makes things much more complicated). This is because when a company is spending a lot more on capital expenditure than it is recording as depreciation, it is likely due to either:
- The company must make capital expenditures that exceed depreciation to maintain competitive, and/or
- The business is making capital expenditures above and beyond its requisite “regular maintenance” capital expenditures.
GM is having the exact opposite. Their depreciation and amortization greatly exceed capital expenditure. This is obviously an impossible situation since future capital expenditures have to be made to cause future depreciation! Either:
- GM is not spending enough to maintain its PPE, or
- This is a temporary state-of-affairs due to purchase of long-life assets (e.g. buildings) or because goodwill or other intangibles are amortized over extremely long periods (maybe 40 years? I don’t know).
In this case, we can’t assume this happy state of “taking bigger tax write-offs than we’re normally allowed” will continue forever, simply because we know that (reality check guys), over the long-term, capital expenditures and depreciation will provide a net sum of zero, and because we’re not worried about understating capital expenditures, we can assume that capital expenditures and depreciation are the same for GM under normal conditions. Any excess benefits will be written-off in the future capital expenditures.
So here’s the actual OE for GM:

In this case, GM’s automotive business looks even grimmer than we originally thought! The company’s operations required nearly $11 billion of cash in 2005 and 2006. In 2007, the business was “hit by a missile”, making things even worse, requiring nearly $47 billion of excess cash just to keep the cars coming off the assembly line! The shortfall was covered by selling financial receivables, playing games with pension and OPEB, refinancing debt, and working some tax magic (very strong warlocks you have there by the way). As expected, the stock price goes down (price will follow value) as the business deteriorated (from $40 to $10):

In summary, FCF is a good short-hand for scanning companies. When a company has minimal reconciliation to net income and steady and predictable capital expenditures, the difference between FCF and OE is close to none. In that case, either can be used for our valuation. Because of margin of safety, a minor difference between FCF and OE would be insignificant when calculating intrinsic value. Thus, most investors would use P/FCF as it is much more easily calculated.
OE, however, is still the best indicator of cash flow from the operating activities of the business, regardless of how management strives to juggle profitability and cash flow. When a company has a large amount of non-cash charges to GAAP earnings, OE is generally a more reliable indicator of business performance compared to FCF. In fact, depending on how creative, aggressive, or cautious management gets, FCF can be extremely skewed in these cases, as we saw with GM. It is noteworthy that, while FCF and OE can be substantially the same, they can also be substantially different.
Lesson learnt: Focus on Owner’s Earnings and use Free Cash Flow as a short-hand, easy to use tool, only if it makes sense.
This article is adapted from Joe Ponzio’s F Wall Street.